Download
1 / 7
90 likes | 215 Views
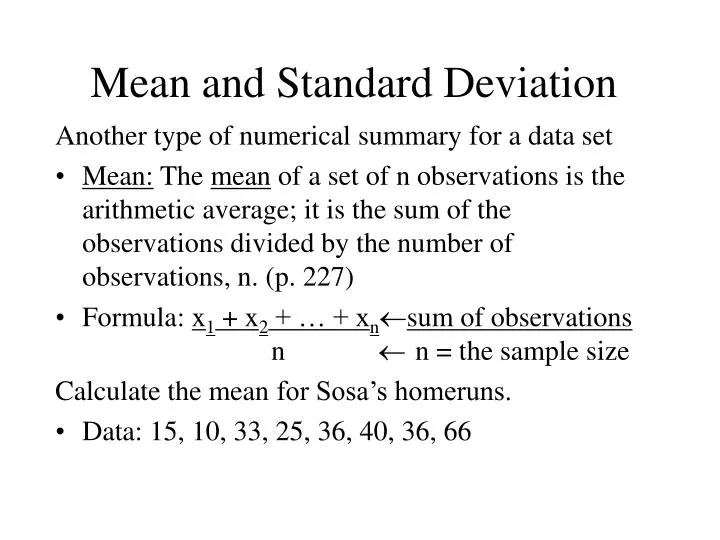
Mean and Standard Deviation. Another type of numerical summary for a data set Mean: The mean of a set of n observations is the arithmetic average; it is the sum of the observations divided by the number of observations, n. (p. 227)

E N D
Mean and Standard Deviation Another type of numerical summary for a data set • Mean: The mean of a set of n observations is the arithmetic average; it is the sum of the observations divided by the number of observations, n. (p. 227) • Formula: x1 + x2 + … + xnsum of observations n n = the sample size Calculate the mean for Sosa’s homeruns. • Data: 15, 10, 33, 25, 36, 40, 36, 66
Measures of Spread or Variability • Data set A: 0 1 2 2 3 3 3 4 4 5 6, n = 11 • Data set B: 1 2 2 3 3 3 3 3 4 5 5, n = 11 • For both, the means, medians, and quartiles are equal. Which is more spread out? x x x x x x x x x x x x x x x x xx x x x x 0 1 2 3 4 5 6 1 2 3 4 5 Data set A Data set B
Variance and Standard Deviation • Variance: The modified average of the squares of the deviations of the observations from their mean. This is denoted by s2. (p. 227) • Standard Deviation: The positive square root of the variance. This is denoted by s. (p. 227) • Variance = Sum of Squared Deviations from the Mean n – 1 • Find the variance and the standard deviation for Sosa’s homeruns.
Why Standard Deviation? • When using the mean for center, the standard deviation makes sense as a measure of spread. • It is a kind of average deviation of the observations from their mean. • Inter-quartile range = IQR = Q3 – Q1. This is a measure of spread when we use the 5-number summary to describe our data.
Choosing a Numerical Summary (p. 232): Recalculating the statistics for Sosa and Maris without the high “outlier”, we get: Mean s Min Q1 M=Q2 Q3 Max IQR Sosa (All) 32.63 17.20 15 20 34.5 38 66 18 Sosa (-66) 27.86 11.54 15 15 33 36 40 21 Maris (All) 24.6 16.02 5 13 23 33 61 20 Maris (-61) 20.6 10.97 5 13 19.5 28 39 15 Which changed more, mean and standard deviation or 5-number summary (median and IQR)?
Mean and Standard Deviation: • The mean and standard deviation are strongly affected by outliers or by the long tail of a skewed distribution. • Appropriate numerical summary when data are not skewed (symmetric) and outliers are not present. • Will work with mean and standard deviation in Chapter 13, normal distributions.
Five-number Summary: • The quartiles are not strongly influenced by outliers or skewed data. • More appropriate thanx and s when the data have a skewed distribution or when outliers are present. • Salary data are usually skewed right (Billionaires92 data set in DoStat), median income is often reported rather than the mean income.