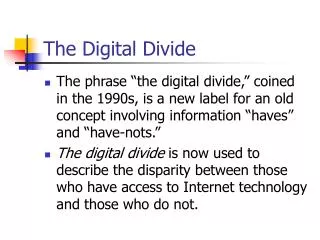
Download
1 / 25
250 likes | 356 Views
An innovative tool to analyze the situation of the Digital Divide in European underserved Regions. Roland A. Burger , SES Astra – Sfera Conference Brussels, 9 October 2009. Agenda. 1 Context of the Regional IS Dimension Internet Revolution, Wikipedia The Long Tail, Wikinomics, Future Internet

E N D
An innovative tool to analyze the situation of the Digital Divide in European underserved Regions Roland A. Burger , SES Astra – Sfera Conference Brussels, 9 October 2009
Agenda • 1 Context of the Regional IS Dimension • Internet Revolution, Wikipedia • The Long Tail, Wikinomics, Future Internet • Open Source • ICT challenges, Sustainable Development • 2 Background Decision Support Tools • 3 Broadband Atlas Prototype • 4 Mapping Data Plane Prototype 2
Internet Revolution 1995: Web Overtakes Gopher, FTP 2000: Peer-to-peer Overtakes Web 2010: Video Content Overtakes Peer-to-Peer 2025: Video Communication Overtakes Video Content 41% CAGR 2007-2012 20,000 Internet Video to TV Internet Video to PC VoIP Video Communications PB/month 10,000 Gaming P2P Web/Data 0 2005 2006 2007 2008 2009 2010 2011 2012 Video Communication VideoContent P2P WWW Gopher, FTP 1993–1995 1995–2000 2000–2010 2010–2025 2025+ Source: Cisco Visual Networking Index – Forecast, 2007-2012 3
Wikipedia, Open Source • Open Source: Software collaboration • Wikipedia: knowledge collaboration • Open Hardware
Wikinomics • Wikinomics: • Openess • Peering • Sharing • Acting Globally 6
The Future Internet • Billions of people, trillions of devices, billions of information sources connected anywhere and anytime • Challenges and opportunities • Internet is expanding from an “information service” to a “critical infrastructure” for all aspects of society • Research aspect: Current technologies need to be improved significantly to meet the challenges of tomorrow 7
ICT potential for Sustainable development at regional level • to decouple economic growth and environmental degradation • to move towards a cleaner, safer and healthier environment • to reduce environmental risk on society • to improve efficiency in the use of raw materials / natural resources • to improve energy efficiency 8
Background Decision Support and Mapping • Regional Decision makers do not have always up-to-date information • Nonexistent Information • Information Overflow • Quality of Information • Have to become Proactive with a Vision 9
Broadband Atlas (BAT) • Our idea is to combine a Top-Down approach with an Bottom-up approach • BAT can become a sort of Wikipedia of Broadband in European Regions • Official Data merged with User contributed data (for instance up/down speed measurements) 10
Lithuania Stupsk Elblag Gdansk Koszalin Suwalki Olsztyn Szczecin Lomza Torun Bialystok Pila Wloalawek Gorzow Wielkopolski Plock Posnan Warsaw Konin Lissa Zielona Góra Lódz Lublin Legnica Piotrkow Radom Chelm Wroclaw Kielce Walbrzych Jelenia Góra Zamosc Czestochowa Rzeszów Tarnów Krakow Bielsko-Biala Przemysl Nowy Sacz Czech Republic Regional Birds view 1 test 14
Test 2: Bulgaria Silistra N Dobritc Vidin Rousse Rasgrad Montana Pleven Sumen Vraza Weliko Tarnovo Targoviste Varna Lovetsch Sofia Oblast Gabrovo Sofia grad Burgas Sliven Pernik Stara Zagora Jambol Kjustendil Pasardshik Plovdiv Haskovo Smoljan Kardshali Blagoevgrad 15
Pommorskie Warminsko-Mazurskie Zachodnio-pomorskie Podlaskie Kujawsko-Pomorskie Mazowieckie Wielpolskie Lebuskie Lódzkie Lubelskie Dolnoslaskie Opolskie Swietokrzyskie Slaskie Podkarpackie Malopolskie Poland – Administrative districts overview 16
Warsaw Wroclaw Warsaw Gdansk Krakow Poland – Cities, Regional Data Screen 17
Pomorskie Warminsko-Mazurskie Zachodniopomorskie Podlaskie Kujawsko-Pomorskie Masowieckie Wielkopolskie Lubuskie Lódzkie Lubelskie Dolnoslaskie Opolskie Swietokrzyskie Slaskie Podkarpackie Malopolskie Poland Regional Overview Screen N 18
Poland – Highlight Regional Data Screen Wielkopolskie This design test is meant to be displayed at the sub-regional zooming level of the Sfera Tool 19
Poland – Highlight districts from Screen interface Dolnoslaskie Prototype for zooming out of selection 20
387 193 432 321 223 421 164 314 398 254 321 179 100 200 300 400 Poland – Numerical Figures Screen • Placeholder with Dummy Data • Dummy numbers Just as a means to test some • data representation 164 273 243 429 21
North • Datafield 1 Aggregation Data. East • Datafield 2 Aggregation Data. • Datafield 3 Aggregation Data. West 5 15 • Datafield 4 Aggregation Data. 23 South Sfera Ind A • Datafield 5 Aggregation Data. • Datafield 6 Aggregation Data. Sfera Ind B Sfera Ind C Poland – Indicators Diagram Screen North West East South 22
Sfera Ind A Sfera Ind B Poland– Diagrams Data Zoom Level 1 Region 4 Region 1 • Data Level Zoom 1 • Data Level Zoom 2 • Data Level Zoom 3 Region 3 Region 2 23
Poland– Sfera Index Diagrams Sfera Index A 63 46 Sfera Index B 35 Sfera Index C Sfera Index D 20 Sfera Index E 10 24
Poland– Sfera Dashboard Diagrams Description A Description B Description C Description D Sfera Regional data visualisation, statistics and analyses 2006 2007 • Data Placeholder 1 • Data Placeholder 2 • Data Placeholder 3 25