Download
1 / 34
340 likes | 466 Views
Overexploitation. Photo of American bison skulls from Wikipedia. Population Dynamics. ∆N. Exponential growth. = r • N. ∆t. Occurs when growth rate is proportional to population size; Requires unlimited resources. N. Time. Population Dynamics. and death (d) rates.

E N D
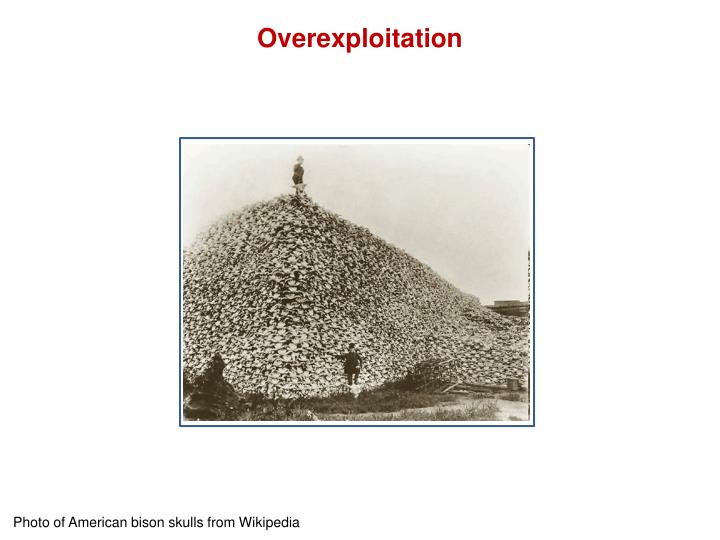
Overexploitation Photo of American bison skulls from Wikipedia
Population Dynamics ∆N Exponential growth = r • N ∆t Occurs when growth rate is proportional to population size; Requires unlimited resources N Time
Population Dynamics and death (d) rates Density-dependent per capita birth (b) Notice that per capita fitness increases with decreases in population size from K b b r or d d Equilibrium (= carrying capacity, K) N
Population Dynamics ∆N N Logistic growth = r • N • (1 – ) ∆t K K = carrying capacity = 0 N is maximized ∆N ∆N ∆N = 0 ∆t ∆t ∆t Time
Population Dynamics & Maximum Sustainable Yield (MSY) Exploitation (harvesting) or overexploitation (overharvesting) ∆N ∆t or Sustainable yield Yield (Y) Rate of net production of new individuals ∆N = ∆t K N
Population Dynamics & Maximum Sustainable Yield (MSY) Constant quota exploitation MSY Sustainable yield Yield (Y) ½ K K N
Population Dynamics & Maximum Sustainable Yield (MSY) Constant quota exploitation High quota This is very rarely truly sustainable (since it is difficult to obtain demographic information to make the predictions and half of the possible intersections on the curve are unstable) MSY quota Low quota Yield (Y) N
Population Dynamics & Maximum Sustainable Yield (MSY) Proportional or “constant effort” exploitation Very high exploitation MSY exploitation Removing a constant fraction of the pop. is more often truly sustainable (since most yields intersect the curve stably), even if there is error in estimating demographic rates Low exploitation Yield (Y) N
Population Dynamics & Allee Effects Allee Effects occur when per capita fitness declines as a population becomes smaller Photo of lekking Attwater’s prairie chickens in Texas from www.nationalgeographic.com
Population Dynamics & Allee Effects Allee Effects occur when per capita fitness declines as a population becomes smaller b ? b or d ? d K N Zone of Allee Effects
Examples of Exploitation of Target Species Logging Subsistence hunting Sport hunting Pest management Fishing Shelling Non-timber forest products Trapping Pet trade Photo of mahogany from www.cites.org ; photo of coyotes on fence from www.life.com
Pleistocene Overkill Hypothesis Pleistocene = 1.8 million to 10,000 yr before present Paleolithic human hunters may have caused the extinction of many species of megafauna (large-bodied birds and mammals) Photo of Giant ground sloth bones from www.corbis.com
The Double-Edged Sword of Hunting The Pleistocene Overkill Hypothesis illustrates the potential negative impacts of too much hunting Remember trophic cascades (e.g., the consequences of removing top predators); now consider the potential positive impacts of well-managed hunting Photo of at least one too many deer in Pennsylvania from www.nrcdeer.com
Policy as a Tool to Combat Overexploitatione.g., legislation on trade in endangered species
Policy as a Tool to Combat Overexploitatione.g., legislation on trade in endangered species Tim Wright et al. (2001) Cons. Biol. Poaching rates of Neotropical parrots were significantly lower after U.S. Wild Bird Conservation Act of 1992 banned trade in wild-caught CITES-listed birds This also indicated that legal and illegaltrade in parrots are positively linked (as opposed to speculation that the two are inversely proportional to one another) Photo from Greg Dimijian
Economic Incentives to Combat Overexploitatione.g., conservation agreement between Conservation International (CI) & Chumnoab Commune, Cambodia Threat: overharvesting of wildlife (e.g., crocodiles) & timber Commune members agreed to several specific measures of good land stewardship in their patchwork landscape of agriculture (rice) & protected forests (wildlife & timber) CI agreed to provide economic incentives, including 8 water buffalo after 1 year (5/25/06 – 5/24/07) Image of domestic water buffalo from Wikipedia; case study from Ted Groves (UCSD), pers. comm.
Economic Incentives to Combat Overexploitatione.g., conservation agreement between Conservation International (CI) & Chumnoab Commune, Cambodia Threat: overharvesting of wildlife (e.g., crocodiles) & timber Compliance monitoring conducted by Cambodia Forestry Administration, an independent party 12 ha cleared illegally by commune members; after renegotiation, 6 water buffalo were provided by CI Collectively, the commune eagerly entered into new contracts in subsequent years Image of domestic water buffalo from Wikipedia; case study from Ted Groves (UCSD), pers. comm.
Economic Incentives to Combat Overexploitatione.g., conservation agreement between Tetepare Descendants’ Association (TDA) & villagers in the Solomon Islands Threat: overharvesting leatherback sea turtle females & eggs Villagers agreed to protect sea turtles by reporting to sea turtle monitors Villagers & monitors receive compensation upon initial report & upon successful hatching So successful that TDA seeks to build an endowment to fund future payments Image of leatherback turtle digging a nest from Wikipedia; case study from Ted Groves (UCSD), pers. comm.
Marine Example ~75% of marine fisheries are considered to be fully fished or overexploited (FAO 2002) Seafood Watch Use the pocket guides to gauge the status of seafood: Web site Photo of Northern bluefin tuna from Wikipedia
Marine Example of Collateral Damage ~30% of marine fisheries “landings” are by-catch Photo of Dall porpoise entangled in a fishing net from Wikipedia
Marine Examples of “Fishing Down Food Webs” Trophic level Time “The Perils of Overfishing – Part 1” - NPR interview with Daniel Pauly Image from http://oceanworld.tamu.edu/resources/oceanography-book/marinefoodwebs.htm
Marine Examples Image of Orange Roughy, a.k.a. Slimehead (Hoplostethus atlanticus) from Wikipedia
Marine Examples Image of Hagfish (family Myxinidae) from http://www.mnn.com
Marine Examples Image of Chilean Sea Bass, a.k.a. Patagonian Toothfish (Dissostichus eleginoides) from Wikipedia
Marine Examples Image of Monkfish, a.k.a. Headfish (genus Lophius) from Wikipedia
Marine Examples Image of Alaska Pollock, a.k.a. Walleye Pollock (Theragra chalcogramma) from Wikipedia
Marine Examples Image of Atlantic Cod (Gadus morhua) from Wikipedia
Marine Examples Image of Peruvian anchovy, a.k.a. Anchoveta (Engraulis ringens) from Wikipedia
Marine Examples Trophic level Time “The Perils of Overfishing – Part 2” - NPR interview with Daniel Pauly Image from http://oceanworld.tamu.edu/resources/oceanography-book/marinefoodwebs.htm
Marine Examples Salmon are carnivores, so farmed salmon are fed fish meal (ground up fish) Pauly encourages us to eat wild-caught salmon (if you live close to a salmon fishery) Image of salmon from Wikipedia
Marine Examples Catfish are often fed soy meal and are often farmed sustainably Pauly encourages us to eat farmed catfish Image of a catfish from Wikipedia
Marine Examples Tilapia are often farmed sustainably (but also often become invasive) Pauly recommends Tilapia for the table Image of a fried tilapia (one of several members of the fish tribe Tilapiini) from Wikipedia
Marine Examples Shellfish (clams, mussels, oysters) are often managed sustainably Pauly also recommends shellfish Image of an oyster from Wikipedia
Marine Examples Small shoaling fish generally feed low on the food chain Pauly also recommends anchovies (Anchoaetc.), herring (Clupea), sardines (Sardina) Image of a herring from Wikipedia