Download

1 / 20
230 likes | 484 Views
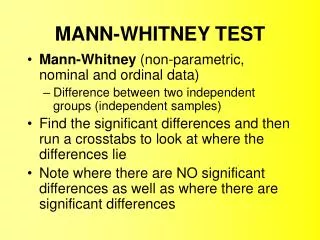
Mann Whitney U For comparison data. Using Mann Whitney U. Non-parametric i.e. no assumptions are made about data fitting a normal distribution Is used to compare the medians of two sets of data It measures the overlap between the two data sets

E N D
Mann Whitney U For comparison data
Using Mann Whitney U Non-parametric i.e. no assumptions are made about data fitting a normal distribution Is used to compare the medians of two sets of data It measures the overlap between the two data sets You must have between 6 and 20 replicates of data The data sets can have unequal numbers of replicates
When to use Mann-Whitney U-test Compares overlap between two data sets Curve not normally distributed ie. non parametric
Method 1. Establish the Null Hypothesis H0 (this is always the negative form. i.e. there is no significant correlation between the variables) and the alternative hypothesis (H1). H0 - There is no significant difference between the variable at Site 1 and Site 2 H1 - There is a significant difference between the variable at Site 1 and Site 2
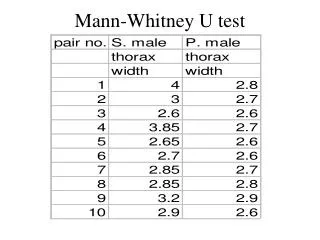
2. Copy your data into the table below as variable x and variable y and label the data sets
3. Treat both sets of data as one data set and rank them in increasing order (the lowest data value gets the lowest rank) Start from the lowest and put the numbers in order: 16, 17, 18, 19, 20, 20, 21, 21, 22, 23, 23, 24, 25
The lowest data value gets a rank of 1 When you have data values of the same value, they must have the same rank. Take the ranks you would normally assign (5 and 6) and add them together (11) and divide the ranks between the data values(5.5) The same thing is done for all data values that are the same
The lowest data value gets a rank of 1 When you have data values of the same value, they must have the same rank. Take the ranks you would normally assign (5 and 6) and add them together (11) and divide the ranks between the data values(5.5) The assigned ranks can then be put into the table
4. Sum the ranks for each set of data ( R) R1 = 10.5 + 7.5 + 10.5 + 5.5 + 12 + 13 + 9 = 68 R2 = 1 + 3 + 4 + 2 + 5.5 + 7.5 = 23
5. Calculate the number of samples in each data set (n) Count the number of samples in each of the data sets n1 = 7 n2 = 6
6. Calculate the Values for U1 and U2 using the equations It is a good idea to break the equations down into three bite size chunks that will then give you a very easy three figure sum
6. Calculate the Values for U1 and U2 using the equations (7x6) +3(6+1) -23 (7x6) +3(7) -23 U1 = 42 +21 -23 = 40 (7x6) +3.5(7+1) -68 (7x6) +3.5(8) -68 U2 = 42 +28 -68 = 2
6. Compare the smallest U value against the table of critical values The smallest U value is U2 = 2 If the U value is less than (or equal to) the critical value then there is a significant difference between the data sets and the null hypothesis can be rejected
(at the 0.05 or 95% confidence level i.e. we are 95% confident our data was not due to chance) Critical Values for the Mann Whitney U test We us the values of n1 and n2 to find our critical value
Is there a significant difference? Smaller Is 2 (our smallest U value) smaller or larger than 6 (our critical value from the Mann Whitney Table)? If the U value is less than (or equal to) the critical value then there is a significant difference between the data sets and the null hypothesis can be rejected The smallest U value is less than the critical value; therefore the null hypothesis is rejected The alternative Hypothesis can be accepted – There is a significant difference between the tree heights of Beech Hill and Rushey Plain
Use the following data to calculate U values independently Abundance of Gammarus pulex in pools and riffles of an Exmoor stream
Key questions Is there a significant relationship? Which data value/s would you consider to be anomalous and why? What graph would you use to present this data?