Download

1 / 55
550 likes | 726 Views
GOLDCAR Rental. Description of general details of the firm. Location Size History Business sector Competitors Organizational structure. Location. Goldcar is one of Spain's leading car hire companies and the largest in the Mediterranean area.

E N D
Description of general details of the firm. Location Size History Business sector Competitors Organizationalstructure
Location • Goldcar is one of Spain's leading car hire companies and the largest in the Mediterranean area. • Our public offices and agencies are located at the leading tourist resorts: the Costa Blanca, the Costa Cálida, the Costa de la Luz, the Balearic Isles and the Costa del Sol. Our branch network and ‘Airport’ system cover a large and vital area of the Mediterranean coastline. We have offices at nine airports, which makes us the car hire company with the greatest presence on the Mediterranean coast.
Size • We currently have 22 offices • A fleet of more than 20,000 vehicles • Highly qualified staff that provides a service to more than 400,000 customers from all over the world. • More than 400 employees at the service of our customers.
History • Goldcar Rental, the new trade name of Europa Rent a Car, was incorporated in 1985 with a view to creating a car hire company that combines both product quality and customer service excellence. History: • 1985The brothers Juan and Pedro Alcaraz began their activity by hiring vehicles from their first office in San Juan de Alicante next to carretera de Valencia with four Ford Fiestas and one Ford Escort.
History • 1987The company opened a second office in Torrevieja (Alicante). • 1988 On 24 August, they constituted their activity as a company, with the trade name of Europa rent a car, s.l. • 1989The company's third office was opened in Benidorm (Alicante).
History • 1994The facilities at Torrevieja (Alicante) were modernised. • 1995They opened a new office at the airport of Valencia. • 1997 In Benidorm (Alicante), the offices were moved to larger premises. And the first licence was obtained in an airport in Alicante.
History • 1999The offices at Denia (Alicante) were opened and the company began to grow rapidly, creating new departments that required a central office in the town of San Juan. • 2000A licence was purchased at the airport of Malaga. The office at Aguilas (Murcia) was opened. • 2001The expansion process continued with the opening of a new office at the airport of Murcia.
History • 2002Opening of offices at the airports of Jerez, Palma de Mallorca and Almería. • 2006The last offices to be opened were those of Gerona and Granada. This year also saw the beginning of the change to the name of Goldcar. • 2007The new GoldcarEuropa project for this year is the opening of new, more modern and better equipped facilities for the central office in the town of San Juan.
Business sector • Since it was incorporated in 1985, Europa Rent a Car has been committed to tourism and has always focused on promoting the supply available in Spain on foreign markets through the provision of a vehicle hire service without chauffeur at the leading tourist resorts in Spain. It has taken an active part in the main tourism fairs in Europe, such as the World Travel Market in London, the ITB in Berlin, the De VakantieBeurs in Holland and Fitur in Madrid, offering a quality service and product as a complement to the other tourist options (beaches, golf courses), hotels and leisure activities (Terra Mítica, etc.). This means that 95% of our customers are foreigners from various countries, especially from Great Britain, which provides 55% of our custom.
OrganizationalStructure • Themainofficeislocatedin Alicante – thisis a headquaters of thewhole company • Theotherofficewhichare dependent on theheadquatersarelocatedinotherlocalizations: Almeria, Cadiz, Girona, Granada, IslasBaleares, Las Palmas, Malaga, Murcia, Sevilla, Tarragona, Tenerife, Valencia
Products and services delivered to customers Design of a newgoodoffered by the firm Goldcarrental
Goldcarrental- products and service • Mainproductisrenting a car in 18 differentplaces on south and east part of Spain(plus CanaryIslands and BalearicIslands) • OptionalEquipment • Cover and insurance • Roadsideassistance
Goldcarrental- renting a car • Goldcarofferseightcategories of cars to rent: • Economic • Compact • FamilySize • FullSize • Automatic • Vans • Cabriolet • Luxury
Goldcarrental • In eachcategorytherearefrom one to sixgroups of different cars. • Thereispossibility to rent an additionalequipment- baby seatsorgpsnavigation. • Goldcaroffersthreeoptions of insurance: normal, middle and relax(thatgivesrenterfullprotectionincase of accident) • GoldcaroffersalsoRoadsideassistance- incase of any problem withthe car(renterjusthave to call to Goldcaroffice)
Goldcarrental- new products • Goldcarisgoing to spreaditsoffer to othercities and regions atIberianPeninsula and developthefleet of cars – itdepends on market needs. NowadaysGoldcar'sstrategyisbased on rentingbrandnew cars ingoodconditions, well-equipped. All theemployees do theirbest to minimizethe time of proccess of renting
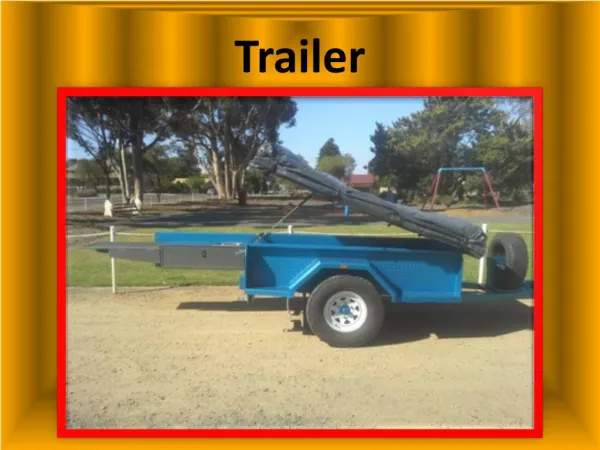
Goldcarrental • Goldcarisgoing to addnewproduct- renting a car thatgivespossibility to carrybiggercargos- likesurfboardsorparachutes for kitesurfers. Cars thatsuits to theseneedsarepickups. Everyyearthereare a lot o peoplethat play thesesports and need to move. Goldcarisgoing to help them.
Pareto Chart The Pareto Chart is used to show the relative importance of a set of measurements. • When to use it: Situations when it is useful. • How to understand it : Details of how it works. • Examples: Some examples of usage.
When to useit • Use it when selecting the most important things on which to focus, thus differentiating between the 'vital few' and the 'trivial many'. • Use it after improving a process, to show the relative change in a measured item. • Use it when sorting a set of measurements, to visually emphasize their relative sizes. • Use it, rather than a Bar Chart or Pie Chart to show the relative priority of a set of numeric measurements.
How to understandit • Given a set of recurring problems, it is unlikely that each problem will occur the same number of times in any one period. In fact, it is common that a few problems will occur far more often than the rest put together. This unequal distribution occurs in many situations and can be used to single out the 'vital few' from the 'trivial many'. • The Pareto Chart is simply a Bar Chart in which the bars sorted into size order, with the highest bar on the left, as below.
How to understandit • This not only shows the absolute priority of each bar, through its position in the chart, but also its relative priority, through its height as compared with the other bars. • As the Pareto Chart is often used for decision making, it is an important parts of building a Pareto Chart to identify the right item to measure and show on the chart, as different measures may well result in the bars be ordered quite differently. • In a stable process, the order of the bars may be expected to remain constant. Thus, if the order of the bars changes with successive measurements, this may indicate an unstable process (or an insufficient number of measurements). Improvements (i.e. changes in the process) will often result in the order of the bars changing. If the improvements are maintained, the new bar order will remain stable. • Pareto Charts may have different overall 'shapes' as shown in the table below. The 'spiky' Pareto Chart is the most useful, as it enables an easy selection of items to carry forwards for further action.
Example • A purchasing department often wasted time going back to managers who gave them order forms which could not be used for some reason or another. So they recorded the problems over one month and plotted a Pareto Chart. A clear majority of problems were due to missing information. To narrow down the cause, they did a survey of managers, asking why they missed out information. The replies fell into four categories, which were plotted in a second Pareto Chart (see Fig. ). As a result, they produced two order forms. One suited most purposes, and was very clear and simple. The other was more complex, but was needed by only a few people.
Cause-Effect Diagram The Cause-Effect Diagram is used to identify and structure the causes of a given effect. • When to use it: Situations when it is useful. • How to understand it : Details of how it works. • Examples : Some examples of usage.
When to useit • Use it when investigating a problem, to identify and select key problem causes to investigate or address. • Use it when the primary symptom (or effect) of a problem is known, but possible causes are not all clear. • Use it when working in a group, to gain a common understanding of problem causes and their relationship. • Use it to find other causal relationships, such as potential risks or causes of desired effects. • Use it in preference to a Relations Diagram where there is one problem and causes are mostly hierarchical (this will be most cases).
How to understandit Solutions to problems are often not easy to find, and those that at first appear to be obvious may address only symptoms rather than the true cause of the problem. Identifying causes as an intermediate step makes solutions both easier to find and also more likely to address the problem fully. Causes tend to appear in chains (Fig. 1), where one cause is caused by another, and so on. Thus an accident may be caused by a puncture, which is caused by a weak tire wall, which is caused by imperfections in the rubber, etc. One cause may also be caused by a combination of other causes. Thus the puncture may be caused by a rough road surface and by sudden braking, as well as a weak tire, as illustrated.
How to understandit The Cause-Effect Diagram uses a specific layout to display the hierarchy of causes, as illustrated. The angled lines enable more detail to be added than lines at right angles to one another, especially in an informal situation where causes are being added 'on the fly'. Each line indicates either a named cause or a cause area which contributes to the cause line to which it is attached. A cause area is not a cause, but may contain causes. For example, a tire may be a cause area but may not be a cause of an accident. A smooth or punctured tire can be a cause. Cause areas tend to be nouns, whilst causes tend to use verbs. When determining causes of a problem, the important causes that need to be addressed are seldom all known, let alone the effects of individual causes on the problem and on one another. The Cause-Effect Diagram is often used to address this by acting as an organizing structure within a Brainstorming session, in which case the causes on the final diagram may be a combination of known, suspected and other possible causes. The Cause-Effect Diagram is often the result of divergent thinking about causes, and must be followed by convergence into the key causes which are to be addressed by further action. To prevent ineffective solutions, these need to be verified as being actual causes before finding solutions for them. Root causes are those at the ends of chains of causes, and which consequently do not have any sub-causes. Root causes of key causes are often worth addressing.
How to understandit A lopsided diagram can indicate an over-focus in one area, a lack of knowledge in other areas, or it can simply indicate that the causes are focused in the denser area. A sparse diagram may indicate a lack of general understanding of the problem or just a problem with few possible causes.
Example • The managing director of a weighing machine company received a number of irate letters, complaining of slow service and a constantly engaged telephone. Rather surprised, he asked his support and marketing managers to look into it. With two other people, they first defined the key symptom as 'lack of responsiveness to customers' and then met to brainstorm possible causes, using a Cause-Effect Diagram, as illustrated. • They used the 'Four Ms' (Manpower, Methods, Machines and Materials) as primary cause areas, and then added secondary cause areas before adding actual causes, thus helping to ensure that all possible causes were considered. Causes common to several areas were flagged with capital letters, and key causes to verify and address were circled. • On further investigation, they found that service visits were not well organized; engineers just picked up a pile of calls and did them in order. They consequently set up regions by engineer and sorted calls; this significantly reduced traveling time and increased service turnaround time. They also improved the telephone system and recommended a review of suppliers' quality procedures.
New productstrategy Goldcarrental
Goldcarrental • Select and describetheprocesssuitablestrategy for theproduct and service • ProcessAnalysis and Design Questions
Goldcarrental • Processfocusedstrategy • New category of cars- pickup • Lowvolume • High variety(of available cars)
Goldcarrental • Advantages • Highiervariety of products available • potentiallywideapplication(pickupscan be used to carring many kinds of cargos) • Lower costs for clients(to carrybiggercargos)
Goldcarrental • Disadvantages • Highier capital investment(pickupsareusuallymoreexpensivethanothertypes of cars thatGoldcaroffers)
ProcessAnalysis and Design Questions • Is the process designed to achieve competitive advantage in terms of differentiation, response, or low cost? Differentiation – because most of competitors don't have such a category of cars • Does the process eliminate steps that do not add value? Yes, process is focused on adding value(in this case- highier variety)
ProcessAnalysis and Design Questions • Does the process maximize customer value as perceived by the customer? Yes – high variety of available cars, lower costs of carring cargos • Will the process win orders? Yes, provided that chosen strategy was correct.
GOLDCAR Rental The tech side of the company The possibilities of Internet as a channel distribution for the products.
The tech side of the company • GoldcarRentalWebsite • Usingthe Internet for rentingcompany’s cars • Easycommunication – email service • Goodinformation system whichconnectseachoffices and helpsinexchanging data, thanks to itcustomercanborrow car in one place and return itintheother
The tech side of the company • Good service of cars(regularcleaning and overhauling cars) whichlet to ourclientsfeelsafeinrented car • Usingbuses to give a lift for customerswhoalreadylandedatairport to getthemstraight to renting company for receiving cars by them
The tech side of the company • Internet Goldcar Rental launches its new website exclusively for the United Kingdom The new website can be found at: www.goldcar.co.uk Thus, Goldcar seeks to provide a better service, more personalized for their customers in the UK. Thewebsitewill gradually add new features and services for English public.
The possibilities of Internet as a channel distribution for the products. • Addinglinks of GoldcarRentalwebsite to otherwebsites(especially to websitesabout travelling) – to make easiergettingnewclientsfromall of theworld. • UsingE-bay and similar services to rent cars – for exampleaddingatthesesitessomerentingbargains.
The possibilities of Internet as a channel distribution for the products. • Advertisementinthe Internet – it’sthebestway to show your company to many clients • Improvingproducts and service from customer specs sent via the Internet • Internet survey – what cars we should rent, clientscan help usintakingdecissions of buyingnew cars