Download
1 / 40
400 likes | 566 Views
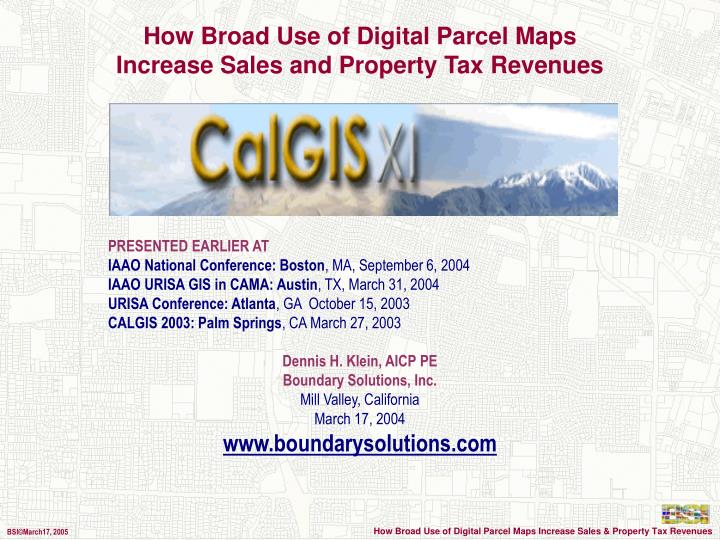
How Broad Use of Digital Parcel Maps Increase Sales and Property Tax Revenues PRESENTED EARLIER AT IAAO National Conference: Boston , MA, September 6, 2004

E N D
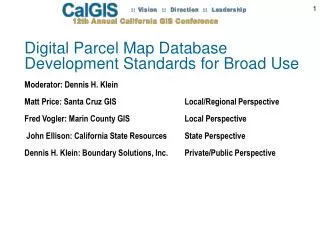
How Broad Use of Digital Parcel Maps • Increase Sales and Property Tax Revenues • PRESENTED EARLIER AT • IAAO National Conference: Boston, MA, September 6, 2004 • IAAO URISA GIS in CAMA: Austin, TX, March 31, 2004URISA Conference: Atlanta, GA October 15, 2003CALGIS 2003: Palm Springs, CA March 27, 2003 • Dennis H. Klein, AICP PE • Boundary Solutions, Inc. • Mill Valley, California • March 17, 2004www.boundarysolutions.com
BACKGROUND • - GIS Location Platform - - national Street Centerline since 1980 DIME File. • Address ranges based. • Addresses displayed as latitude / longitude points. • Big breakthrough but ERROR PRONE. • Parcel Boundaries instead of Address Points. • What’s inside a parcel boundary is at an addressvs. around a point in or near a parcel. • What’s at an address is inside a parcel’s boundary.
Vs. PARCEL BOUNDARIES 347 Hazel Ave. Maporama 347 Hazel Avenue Mill Valley, CA MapQuest Map Point 450’ Error Digital Parcel Boundary Map 347 Hazel Avenue Accuracy ADDRESS POINTS
Accuracy • Boundary-based location is not a remedy unless boundaries are accurate. • Much content produced in the last five years is highly accurate. • Latest GPS, survey control, image rectification technology. • - Over 85% is within 4-6 ft.
Accuracy Percent Parcel by Accuracy Category (60 Million Parcels) (Source: NPDP MetaData Database Records)
Availability - Distributed across over 3000 county / township jurisdictions. - Of the 120 Million Parcels in the USA, over 70 Million are now digitized.
Growth By Millions of Parcels Total Digital Parcel growth Is nosing over as all large counties finish their maps. Growth By Jurisdictions with Finished Digital Maps Total Finished Map growth is nosing up as many smaller counties complete their maps. Availability
Availability - - Projected PROJECTED COVERAGE: 2010 – Assumes all counties > 20,000 Population have a map. Total Counties: 1850 (Total Population 260 Million) Total Parcels: 105 Million(Assumes 2.42 persons/parcel) Includes several Jurisdictions under 20,000 that have or will soon have a finished map.
DATA SHARING POLICIES Private sector cannot use the data unless its price is low enough. Market realities to date set this threshold around $0.0025 per parcel. Data priced too high makes it invisible to the… - Banking - Insurance - Real estate development - MLS - Utility - Emergency Response Companies Today, approximately 75% of all databases are available below this threshold.
DATA SHARING POLICIES ENTIRE JURISDICTION DATABAE PRICE – SAMPLE: 566 JURISDICTIONS (Source: NPDP MetaData Database Records)
DATA SHARING POLICIES $/PARCEL PRICE – SAMPLE: 67,000,000 Parcels (Source: NPDP MetaData Database Records)
DATA SHARING POLICIES • Approximately 25% of digital parcel map databases are INVISIBLE due to insistence on COST-RECOVERY pricing. • DOUBLE PROBLEM. • As more jurisdictions go cost-of-duplication, COST RECOVERY pricing results In… • - NO Data being sold -> NO REVENUE. • NO Data being used -> Deprivation of VERY LARGE revenues from broad data use.
Broad Use of Digital Parcel Data Generates major revenues derived from: 1. Optimized, More Accurate Real Estate Transactions. 2. Reduced Insurance Premiums Prices. 3. Lower Cost Infrastructure Operations. 4. Long Term Improved Built Environment. 5. Increased Attraction of Major Economic Development Projects.
PUBLIC INTEREST BENEFITS 1. Optimized More Accurate Real Estate Transactions • - Flood and other natural hazard Certification service company operations… • Current practice - buffering address points • According to US Postal Service database (4 digit Zip Code extension). • - Highly accurate when all properties along a street have uniform frontage. • - Because this is often not the case…. 10% - 20% can fall outside parcel…. • - Uneven property frontage.- Flag lots and unnamed alleyways.- Irregular shaped lots.- Non-compliant address assignments.
PARCEL BOUNDARY CORRECT ADDRESS POINT ADDRESS POINT ADDRESS FINDING FINDING FINDINGCOMMENT 117 New Street NO NO YES Over Reporting 312 Lake Street YES YES 117 New Street 312 Lake Street x x 1. Optimized More Accurate Real Estate Industry Operations NO Under Reporting HAZARDOUS CONDITION
1. Optimized More Accurate Real Estate Industry Operations Since exact limits of flood and other natural hazard zones is uncertain…. 50’ + buffering is a typical practice. 98% of all government sponsored digital parcel map data within 40 ft. As a result…. Parcel layer has become a viable location platform for Natural Hazard Certification Determination. Therefore, ARGUABLY… More accurate and efficient real estate/financial operation will result over time in increased property values and, hence, property tax revenues.
For Example…Optimized Real Estate Operations Induced Tax Increase JURISDICTION Monterey County, CA Dallas County, TX, OH Parcel Count 111,489 820,000 Total Assessed Value $34,700,000,000 $163,000,000,000 Increased Real Estate Property Values 1% 1% Property Tax Rate %1.10 %2.4 POTENTIAL TOTAL INCREASED REVENUES $3,539,400 $39,168,000 BUT THIS is possible ONLY IF digital data is priced LOW ENOUGH for BROAD USE.
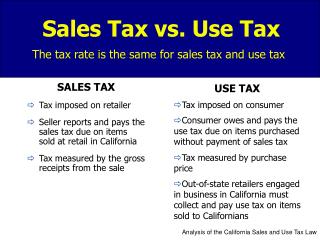
2. Reduced Insurance Premiums Prices Large insurance companies and all others served by Insurance Service Office (ISO). Rates set by bufferering lat/long address points to determine if property is in … - Wild Fire Zone - Flood Zones - High Crime Zone - Faults, Tsunami, Seismic Zone - Subsidence / Landslide Zone - Which Fire District - Others
2. Reduced Insurance Premiums Prices Manual examination impractical. Findings depends exclusively on “machine readings”. Underlying uncertainty is “written off” and ... Passed on to the consumer by being added to the premium price (15% EXTRA) This accuracy problem is eliminated by replacing Address Points with Parcel Boundaries.
RESULTING MEASUREMENTS Used to Generate Accurate Insurance Ratings P1 P1 P1 P2 P2 P2 P1 P1 P1 P2 P2 P2 2. Reduced Insurance Premiums Prices ERROR FREEParcel Based Location PlatformInsurance Premium Rate Processing WILD FIRE FAULTS SEISMIC ZONES CLOSE TO SHORE HIGH CRIME AREAS FIRE DISTRICTS
2. Reduced Insurance Premiums Prices Assuming normal market influences, increased accuracy ofparcel boundaries over buffered address points results in up to a 15% reduction in premium prices. Broad use results in data sponsor being subject to major insurance savings. Also, ARGUABLY… - Money not spent on insurance is spent locally, increasing sales tax revenues.- Insurance savings enhances location desirability, real estate values and tax base.
For Example…Lower Insurance Premium Induced Tax Increase JURISDICTION Monterey County, CA Dallas County, TX, OH Parcel Count 111,489 820,000 Total Assessed Value $34,700,000,000 $163,000,000,000 Premium Price / Assessed Value Ratio 1% 1% Greater Accuracy Induced Premium Reduct. 12% 12% Savings Spent on Sales Tax Items 80% 80% Sales Tax Rate 7.25% 8.25% POTENTIAL INCREASED SALES TAX $2,415,000 $12,925,000 BUT THIS is possible ONLY IF digital data is priced LOW ENOUGH for BROAD USE.
3. Optimized Lower Cost Infrastructure Operations. • Private sector utility service areas can cover many counties. • Traditionally, their land bases have been planimetric maps of - Pavement edges. - Other Land Features. • For the first time, many counties in their service areas have completed parcel maps. • Utilities have a growing interest to add an “intelligent” parcel boundary layer. • Gas companies recently driven by federal DOT High Consequence Area Analysis for improved public safety. • - Greater detail to expedite facility planning, design, maintenance and operation. • Improved emergency response from more accurate address location. • Tightened billing by reconciling customer records with corresponding address. -
3. Optimized Electric/Gas/Telephone Utility Operations • TOGETHER, these benefits yield • Lower operation cost and increased service quality. • Assure competent service without rate increases… • EVEN DECREASES. • ARGUABLY, disposable income not spent on utility bills is spent locally on other stuff • Pumping up Sales Tax. • And making the community a more desirable “location” • Pumping up real estate prices and hence, property tax base. -
For Example…Lower Utility Bill Induced Tax Revenue Increases JURISDICTION Monterey County, CA Dallas County, TX, OH Parcel Count 111,489 820,000 Total Assessed Value $34,700,000,000 $163,000,000,000 Potential Utility Bill Reduction 5% 5% Average Annual Utility Bill Per Parcel $4,500.00 $5,000.00 Utility Bill Savings Spent on Sale Tax Items 80% 80% Tax Rate 7.25% 8.25% POTENTIAL SALES TAX INCREASE $1,455,000 $12,177,000 BUT THIS is possible ONLY IF digital data is priced LOW ENOUGH for BROAD USE.
4. Long Term Improved Built Environment. All atrocious, hideously incompatible developments have one thing in common. They all received a majority vote at city council / county board of supervisors. How do really bad projects get approved? A long standing political reality - - to get reelected, you have to… “Dance with the one who brung ‘ya.”
4. Long Term Improved Built Environment. When partners are community groups and watchdogs, little chance of bad projects. When main partners are development interests, bad projects will happen. There is nothing wrong with this picture. This balance of power is just the way it is.
4. Long Term Improved Built Environment. Easily available GIS data Databases changes this picture. Best of all, does not challenge the way it is. But tips the process just the same. Typical out-of-time and out-of-money developer rushes about pursuing their interest - - maximizing profits. Far more concerned about having three votes than whether it makes sense. Classic result: wrong use, wrong site, wrong configuration. Spewing out traffic and waste in all the wrong places.
4. Long Term Improved Built Environment. The difference the data makes… Same time required to physically attain a copy of a deed description, same developer can turn on their computers and reference not only the parcel(s) description but… Surrounding use patterns Relative assessed value Relative age Use code / zoning Block level demographic/ economic characteristics Traffic intensity General plan designations Natural and manmade hazards Flora and fauna And more
4. Long Term Improved Built Environment. When spatial data is common enough, it becomes commonly used. Without even meaning to, the same developer decides to: - DO NOTHING - - lure of cheap land offset by early recognition of excessive costs. - Spatially query entire region to find more amenable (profitable) site. - Check for incompatible conditions and configures adjusted accordingly. - Uses better understanding of neighborhood to optimize use and configuration.
4. Long Term Improved Built Environment. • The more spatial data is used,The more the built environment is subject to improvement over time causing… • The jurisdiction to become a more desirable “location”. • Real estate prices and attendant property valuation / tax revenues to increase.
For Example…Improved Built Environment Induced Tax Increase JURISDICTION Monterey County, CA Dallas County, TX, OH Parcel Count 111,489 820,000 Total Assessed Value $34,700,000,000 $163,000,000,000 Quality Induced Property Value Increase 1% 1% Property Tax Rate %1.10 %2.4 POTENTIAL TOTAL INCREASED REVENUES $3,539,000 $39,168,000 BUT THIS is possible ONLY IF digital data is priced LOW ENOUGH for BROAD USE.
5. Increased Attraction of Major Economic Dev. Projects Rappatoni Corporation is implementing parcel boundary based Multiple Listing Services. FARES just purchased MarketLynx to do the same. About 40 Metros already linked to digital county databases. Subscriber in Hong Kong can browse for “dream parcels” wherever there is coverage.
5. Increased Attraction of Major Economic Dev. Projects If your jurisdiction is in one of these systems, you are “visible”. When constraint is high (price, restrictive use) the Jurisdiction is “invisible”. How much more is the GIS budget protected when… Recently attracted out-of-state major (even “green”) economic development projects can be cited rather than last year’s data sales revenues.
For Example…Attracted Capital Project Generated Tax Increase JURISDICTION Monterey County, CA Dallas County, TX, OH Parcel Count 111,489 820,000 Total Assessed Value $34,700,000,000 $163,000,000,000 Ratio Additional Capital Projects / Tax Base 1% 1% Potential Increase in Property Tax $347,000,000 1,010,000,000 Property Tax Rate %1.10 %2.4 POTENTIAL TOTAL INCREASED REVENUES $3,530,000 $39,168,000 BUT THIS is possible ONLY IF digital data is priced LOW ENOUGH for BROAD USE.
SUMMARYTOTAL POTENTIAL INCREASED SALES AND PROPERTY TAX REVENUE INCREASED TAX REVENUES FROM MONTEREY,CA DALLAS, TX OPTIMIZED REAL ESTATE OPERATIONS $3,539400 $39,168,000 LOWER INSURANCE PREMIUMS $2,415,120 $12,925.440 LOWER UTILITY BILLS $1,455,000 $12,177,000 IMPROVED BUILT ENVIRONMENT QUALITY $3,539400 $39,168,000 OUT-OF-TOWN FINANCED DEVELOPMENT $3,539400 $39,168,000 ANNUAL TOTAL INCREASED TAX REVENUE INCREASE $14,488,000 $142,600,000 BUT ALL THIS is possible ONLY IF digital Parcel Map data is priced LOW ENOUGH for BROAD USE.
CONCLUSION…. What’s in it for the Data Sponsor? To Manage your information assets… not to make money off the data, but to expedite its BROAD USE, benefits you in three ways… o Financially benefits every resident and business. o Increased Sales Tax Revenues. o Increased Property Tax Revenues.
CONCLUSION…. This presentation has communicated to you the sources and potential magnitude of future revenue increases induced from BROAD USE of digital parcel map databases. It is up to you to figure out how to direct the fare portion you need to operate the Assessor’s Office in general and the GIS Division in particular. One thing is for certain, BROAD USE of digital parcel map data is far more interesting than CONSTRAINED USE.