Download
1 / 53
530 likes | 671 Views
FRAMES and Other IEM Technologies. Ecosystems Research Division March 12, 2012. Interoperability and Coherency. Interoperability The ability of two or more systems or elements to exchange information and to use the information that has been exchanged (IEEE 1989) Coherency

E N D
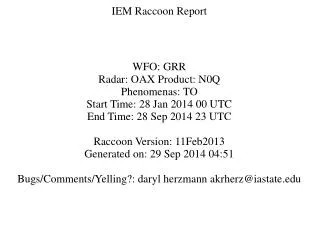
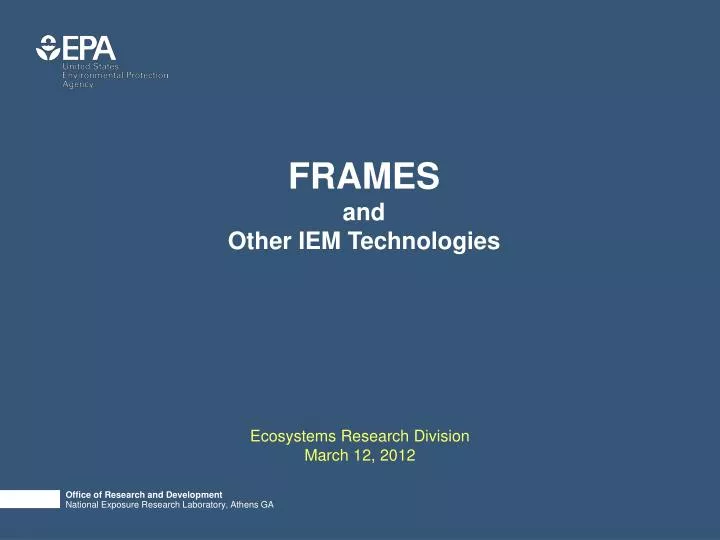
FRAMES and Other IEM Technologies Ecosystems Research Division March 12, 2012
Interoperability and Coherency • Interoperability • The ability of two or more systems or elements to exchange information and to use the information that has been exchanged (IEEE 1989) • Coherency • A systematic connection or consistency that integrates diverse elements, relationships, or values, where "nearby" things have the same or similar characteristics (van Zijl 2005; Merriam-Webster 2011).
CHOWAN ROANOKE PASQUOTANK TAR-PAMLICO CURRITUCK SOUND NEUSE VISION
Input Data Access Databases
Automate those portions of an assessment that are manually repeated Focus resources on analysis, not data gathering VISION
Sensitivity/Uncertainty (SuperMUSE) Data Access, Retrieval, and Processing Field and Laboratory Monitoring Sampling Measurements Sorption studies Inactivation and die-off rates Mortality kinetics Impacts: Sunlight, Temp Data Access, Retrieval, and Processing (D4EM) Met data Soils &Topography Land use/cover Watershed/Stream Delineations Exposure Exposure Intake Intake Risk Risk FRAMES Integrated Modeling System Fate & Transport Health Impacts Dose-Response Relationship Source-term Loadings Watershed Hydrology SuperMUSE • links a clustered network of PCs • distributes runs (all models) across PCs • facilitates sensitivity and uncertainty analyses • visualizes results Simulations/Sampling Water body Network Receiving Waters (at Receptor Locations) Iterate on sources, watersheds, water bodies and receptor locations Technologies Data Access, Retrieval, and Processing Policy-related Issues Risk target(s) Problem Definition Pathogens Identification Etiologies Properties Scenarios Baseline Alternatives Field and Laboratory Monitoring Sampling Measurements Sorption studies Inactivation and die-off rates Mortality kinetics Impacts: Sunlight, Temp Problem Definition Pathogens Identification Etiologies Properties Scenarios Baseline Alternatives Data Access, Retrieval, and Processing (D4EM) Met data Soils &Topography Land use/cover Watershed/Stream Delineations FRAMES – Facilitates the seamless linking and execution of disparate models and databases QMRA Investigations Site characteristics and pathogens Model scale and resolution Risks by varying hydrologic conditions Source apportionment Risk by pathogen, fecal source, water type D4EM – Accesses, retrieves, and processes data MapWindow – Free, extensible, geospatial mapping tools Sensitivity/Uncertainty (SuperMUSE) FRAMES Integrated Modeling System Epidemiology Studies Fate & Transport Health Impacts Dose-Response Relationship Source-term Loadings Watershed Hydrology Simulations/Sampling Water body Network Receiving Waters Risk Quantification (at Receptor Locations) Iterate on sources, watersheds, water bodies and receptor locations
Framework for Risk Analysis inMultimedia Environmental Systems(FRAMES) Acknowledgements: EPA-ERD, EPA-ORIA, DOE-PNNL, NRC, DoD-ERDC AquaTerra
FRAMES Requirements • Allows for the seamless transfer of data betweendisparate models, databases, and modeling systems. • User gets to pick models and databases of choice. • Intuitive system that can be modified and updated by users.
FRAMES Editors Domain Editor Module Editor Dictionary Editor (Units) Conversion Editor Data Client Editor Simulation Editor Groups Models Registers Models Registers Input/Output CSM Workspace Registers Units User Interface Viewer Module Execution Management Data Exchange Protocols System Tools
Domain Editor Specific applications or organizations can have their own Domains Each Domain contains its own ● Structure ● Models, Databases, viewers, and system tools ● Icons
Example Dictionary Chemical Water Concentration Dictionary Metadata Describing Concentration as a Function of Time and Location
Dictionary Editor DICtionaries by Domain
Boundary Condition DICs in the Environmental Domain Creates new DICs Registers existing DICs in System Registers DIC to specific Domain Function of • Space • Time Example Dictionary Screen for AquiferFlux
1 m2 = 1.0E4 cm2 (Units) Conversion Editor
Module Editor List of registered modules under the “Environmental” Domain • Registers existing Module in System • Registers Module to specific Domain
Connection schemes consist of DICs that are consumed and produced.
Simulation Editor Picture Global Workspace Icon Palette Model Choices Grouped by Type Local Workspace Connections between modules are checked for validity by the system
Right-click Over Icon Viewing Packages
Applicable Models Non-applicable Models Missing data
Applications • National-scale Assessment (3MRA) • Regional-scale Assessment (APES) • Watershed-scale Assessment (Pathogens) • Local-scale Assessment (Murmansk) • Site-specific Assessment (Watkinsville) Acknowledgements: EPA-ERD, EPA-AMAD, EPA-OSW, DOE-PNNL, RTI, TetraTech, HydroGeologic
Waste Site National-scale Assessment • Regulating waste streams prior to disposal on a National Level • 201 Waste Sites and Surrounding Area • Question: What is the probability of protecting a percentage of the population as a function of • Chemical • Waste type • Distance from the source • Exposure pathway • Receptor type • Cohort • Acceptable Risk Level
Science Modules and Connectivity Ecological Risk Terrestrial Food Air Surface Web Impoundment Aquatic Food Aerated Web Tank Ecological Exposure Surface Watershed Water Landfill Human Exposure Waste Pile Land Vadose Application Aquifer Farm FoodChain Zone Unit Human Risk Sources Transport Foodchain Exposure/Risk
Overlays of Spatial Data (National, Regional, Site-specific) X Populations X Ecological Habitats/Ranges X Watersheds X Rivers/Lakes X Grid System (Distances) X – Contamination Source
HumRcp 1 HumRcp 10 HumRcp 13 HumRcp 2 HumRcp 11 HumRcp 14 HumRcp 3 HumRcp 12 HumRcp 15 HumRcp 4 HumRcp 16 HumRcp 5 HumRcp 17 N N connections 2 connections 1 connection HumRcp 6 HumRcp 18 HumRcp 7 HumRcp 19 HumRcp 8 HumRcp 20 HumRcp 9 BG 1 BG 2 Air Source 12 8 Range 1 Range 2 Range 3 Hab 1 LWS 1 LWS 2 Range 1 Range 2 Range 3 Vad 1 Vad 2 WSSub 1 WSSub 2 WSSub 3 WSSub 4 Hab 2 Aqu 1 Aqu 2 9 3 12 Rch 1 Rch 2 Rch 3 Rch 4 8 12 8 WBN 1 Farm 1 Farm 2 8 At one-tenth scale Ring 1 Ring 2 Ring 2 Ring 3 12 Ring 3 8
Applications • National-scale Assessment (3MRA) • Regional-scale Assessment (APES) • Watershed-scale Assessment (Pathogens) • Local-scale Assessment (Murmansk) • Site-specific Assessment (Watkinsville) Acknowledgements: EPA-ERD, EPA-R4, AquaTerra, Dan Ames (ISU)
APES Analyses • Evaluate climate change • Evaluate ecosystem services • Mercury and Nutrients analysis • Freshwater Fisheries Analysis
CHOWAN ROANOKE PASQUOTANK TAR-PAMLICO CURRITUCK SOUND NEUSE
Designated Headwater HUC12s Representing Physiographic Provinces
Illustrative Example of Regional Roll-up Source: 25-yr BASS spin-up simulations of 363 EMAP Mid Atlantic Highland streams assuming repeated annual water temperature and discharge regimes.
Applications • National-scale Assessment (3MRA) • Regional-scale Assessment (APES) • Watershed-scale Assessment (Pathogens) • Local-scale Assessment (Murmansk) • Site-specific Assessment (Watkinsville) Acknowledgements: EPA-ERD, EPA-OW, DOE-PNNL, Soller Assoc
Grazing Cattle (4.8 km) Onsite Application (3.2 km) Storage Pond (4.0 km) Recreator Instream Shedding (2.4 km) Tributary Inflow (4.8 km) 10 major storm events/yr
Purpose • Identify which sources contribute to risk (Source Apportionment) • Identify which Pathogens dominate the risk: • E coli 0157 • Salmonella • Cryptosporidium
Conceptual Site Model One model simulates all media and risk
Time-varying Concentrationsfor Cryptosporidium at Receptor A F E D B B B B C C C
Pond Overflow Land Application Runoff Direct Shedding to Stream Pond Overflow Land Application Runoff 1 2 3 4 1 4 2 SourceApportionment 4 1 2 3 4 1 2 4 1 1 2 3 4 2 Storm Event 41
A D E F B B B B C C C Risk of Infection due to Second Storm Event
Applications • National-scale Assessment (3MRA) • Regional-scale Assessment (APES) • Watershed-scale Assessment (Pathogens) • Local-scale Assessment (Murmansk) • Site-specific Assessment (Watkinsville) Acknowledgements: DOE-PNNL, NRC, VitalyEremenko,
44 Nuclear Fuel Storage atMurmansk, Russia, Submarine Base • Purpose • Determine maximum exposed individual risks to the surrounding population, posed by nuclear fuel storage at the Murmansk, Russia, Submarine Base • Potential population risks were modeled for selected exposure scenarios.
Applications • National-scale Assessment (3MRA) • Regional-scale Assessment (APES) • Watershed-scale Assessment (Pathogens) • Local-scale Assessment (Murmansk) • Site-specific Assessment (Watkinsville) Acknowledgements: EPA-ERD, EPA-OW, DOE-PNNL, Clancy, Soller Assoc., USDA-ARS (Pachepsky, Guber, Franklin)
Watkinsville Analyses Purpose: ● Understand and model release, fate, and transport of microbes in a controlled natural environment ● Correlate Pathogens and Indicators • 36 Monitored Plots (2 m by 0.75 m) • Modeled rainfall runoff of four manure applications by season (cattle, poultry, and swine) • 8 microbes • Accounted for aging (0, 1 wk, 2 wk) • KINEROS2/STWIR and PEST Models