Download
1 / 36
630 likes | 1.79k Views
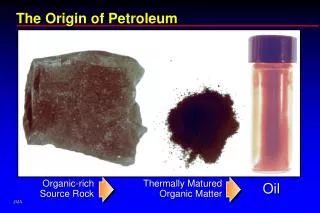
Origin of petroleum. Petroleum is defined as gaseous, liquid, and semisolid naturally occurring substance that consist chiefly of hydrocarbons. Petroleum is therefore a term that includes both oil and natural gas .

E N D
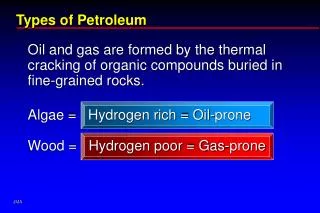
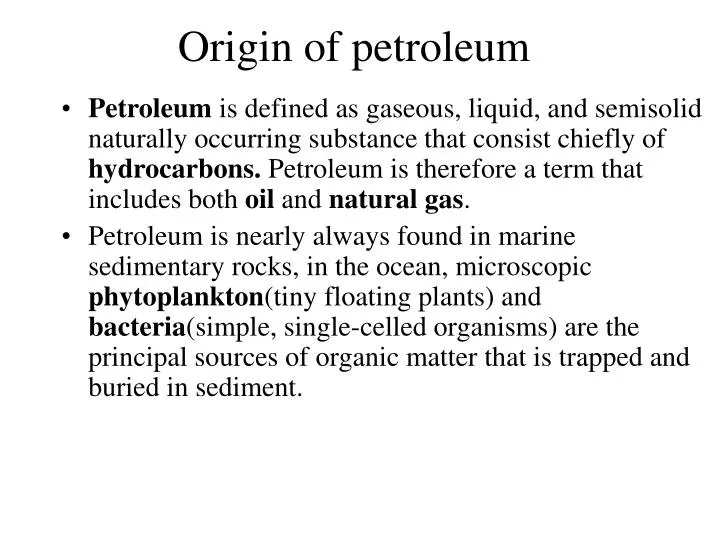
Origin of petroleum • Petroleum is defined as gaseous, liquid, and semisolid naturally occurring substance that consist chiefly of hydrocarbons. Petroleum is therefore a term that includes both oil and natural gas. • Petroleum is nearly always found in marine sedimentary rocks, in the ocean, microscopic phytoplankton(tiny floating plants) and bacteria(simple, single-celled organisms) are the principal sources of organic matter that is trapped and buried in sediment.
Sucession 消長 10-1000 years • Pioneer community climax community • seral stage: annual herb perennial herb shrub pioneer forest climax forest • hydrosere and xerosere • primary sucession初級消長(prisere) and secondary sucession次級消長(subsere)
Cause of sucession • Allogenic factor(allogenic succession: ecological change or development of species structure and community composition brought about by some external force, such as fire or storms) • autogenic factor: ex: 生物引起之土石崩解 原因: 1.遷入 2.生長 3. 作用 4. 交互作用(autogenic succession: succession driven by environmental changes brought about by the organism themselves)
The models for the relationship between the early and later successional species • Facilitation model:reactions of the earlier species make the environment more suitable for later successional species • tolerance model: reactions or the earlier species have little or no effect on the growth of the later species • inhibition model: reactions of the earlier species make the environment less suitable for later species
Sucession models • Floristic relays and initial floristic composition
The role of coaction • Coaction competition non-competition • in competition coaction: plants for the habitat and energy catching, animals for the habitat • the non-competition coaction is also important
Sand dune sucession • lower beach: the waves arrive in summer middle beach: the waves arrive in winter upper beach: no waves • the biota of the lower and middle beach depend on the lake • the sand dune forms in the upper beach
The climax community • 1. 忍受群落中各物種之作用 • 2.氣候相對中央(pioneer community is xeric or hydric) • 3. 高組織性 • 4. High biodiversity(fire increase the biodiversity) • 5. The volume of organism is lager, the life-span is longer, and lower biotic potential) • 6. net community production = 0 • 7. Climax ecosystem is more stable
演替巔峰理論 --Monoclimax hypothesis • Cowles and Clement • 演替途徑: 遷移 定居 群聚 競爭 反應 穩定 • climate climax • proclimax前巔峰(原頂級群落) • subclimax亞巔峰 • disturbance climax偏途巔峰 • preclimax預巔峰 • postclimax後巔峰(超巔峰) • Clement suggest the direction is progressive succession (not regressive sucession)
演替巔峰理論--polyclimax hypothesis • Climax: 群落自行繁衍並結束演替過程 • 群落演替之結果並不一定皆為共同之climatic climax終點, 只要一種或數種因子共同作用而使群落長期保持穩定 • 與monoclimax hypothesis 之差異: 演替之決定因素, 同一氣候區內群落是否趨同發展?
演替巔峰理論-- climax-pattern hypothesis 巔峰格局假說, population pattern climax theory 族群格局巔峰理論 • 各類型之巔峰群落如: 氣候 土壤 地形 火山等巔峰不截然離散, 而呈連續變化, 構成連續變化之格局
太陽光用於光合作用效率低之原因 • 1. 只有4%之光之頻率在可用範圍(red and blue light) • 2. 強光不利光合作用(light saturation point) • 3. 地球大多地區整年皆無法行光合作用 • 4. 生長季節之光合作用仍受溫濕礦物之限制 • 5. 植物光合作用之極限(LAI=4) • 6. 水中環境 產量被溫度 光度 營養鹽所限制 水中每20m 光強減一半 海洋 10m 一般湖泊1-2m
Trophic level Producer consumer- primary berbivore secondary carnivore tertiary omnivore decomposer scavengers • scavengers are animals that eat dead plant and animal material. • food chain and food web
pyramid • Pyramid of biomass: diagrammatic representation of biomass at different trophic levels in an ecosystem. • Pyramid of energy: diagrammatic representation of the flow of energy through different trophic levels. • Pyramid of numbers: diagrammatic representation of the number of individual organisms present at each trophic level in an ecosystem; the least useful pyramid
ecosystem • A. G. Tansley 1935 in the journal Ecology • Ecosystem is the bioitic community and its abiotic environment functioning as a system. • The primary focus of ecosystem ecology is the exchange of energy and matter. • An ecosystem with no inputs is called a closed ecosystem; one with inputs is an open ecosystem.
Measurement of energy • 能量=水體積 X 水溫之上升(bomb calorimeter) • unit of energy: cal, BTU(british thermal unit)(一磅水升高華氏一度)(1BTU=252 cal), Joule(1 Joule= 0.24 cal)
biomass • Organism 之重量(dry weight) • standing crop 現有量 • biomass 無法被正確估量之原因 1. 植物各部分無法全部收集(落葉 地下部分) 2. 無法估計被取食量 3. 寄生性之消費者存在則更難估計
productivity • Primary productivity: gross primary productivity(GPP) and net primary productivity(NPP) NPP=GPP-R • net community productivity(NCP) NCP=GPP-R-consumption by other consumers • the ecosystem is stable if GPP= the total respiration of all organisms in the community(P/R=1)
P/R >1 : autotrophic community P/R <1 : heterotrophic community • efficiency(生態效率)= output/ input (of energy) GPP/solar radiation (photosynthetic efficiency) GPP/light adsorbed (assimilation efficiency) NPP/GPP (effective primary production) • ecological growth efficiency(P/I)= assimilation efficiency(A/I)X Production efficiency(P/A) (p325)
ecological growth efficiency • Herbivores homoiotherms 0.1-1.5% poikolotherms 9-25% • carnivores homoiotherms 0.6-1.8% poikolotherms 12-35%
Productivity increasing • Increasing the efficiency of photosynthesis • consumer control subsidize energy • solar energy • tide • wind
Measurements of PP • Harvest measurement • CO2 measurement • O2 measurement\ BOD(biochemical oxygen demanding) measurement\ light-dark method BOD bottle 350ml water sample fill O2 to saturation 330C 5 days after measurement the concentration of O2
Method: GP= NP+R NP=LB-IB R=IB-DB then: GP=LB-DB • pH measurement • Chlorophyll measurement 海藻: 3.9g carbonhydrate/g chl hr • isotope measurement: C14/C12
為何食物鍊無法太長 • Lindemann’s efficiency: in lake, no secondary consumer if the NPP< 10g/ m2 year • inhibition of evolution • optimal foraging • dynamic inhibition
NPP and plant biomass comparison in ecosystem • 珊瑚礁, 熱帶雨林,沼澤(swamp), 河口(estuaries),耕地(cultivated land) 之NPP高 • 岩石,冰原,高山寒原,沙漠 NPP低 • 海洋NPP低(有 upwelling則NPP高)
影響ecosystem NPP 之因素 • 緯度 • Nutrient • 雨量/ 濕度 <250mm/year 250-750 >750 ecosystem desert grass forest producer few middle many productivity low middle high
Grazing • water depth • canopy structure • wind
Energy allocation • Plant photosynthesis for leaf, stem, bark, root, flower, fruit, seeds • phytoplankton for cell division • annual plants for leaf, in reproductive season for flower • annual plants in desert for roots • perennial plants depend on the seasons and latitude:
Food chain and food web analysis( feeding habitats analysis) • Observation • stomach content analysis • fecal analysis