Download
1 / 24
240 likes | 358 Views
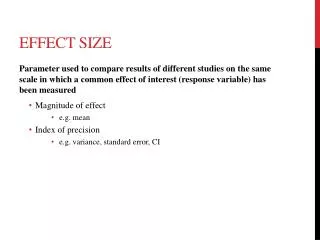
Effect Size. Mechanics. COHEN’S D (HEDGE’S G). Cohen was one of the pioneers in advocating effect size over statistical significance Defined d for the one-sample case. COHEN’S D. Now compare to the one-sample t-statistic So

E N D
Effect Size Mechanics
COHEN’S D (HEDGE’S G) Cohen was one of the pioneers in advocating effect size over statistical significance Defined d for the one-sample case
COHEN’S D • Now compare to the one-sample t-statistic • So • This shows how the test statistic (and its observed p-value) is in part determined by the effect size, but is confounded with sample size • This means small effects may be statistically significant in many studies (esp. social sciences)
COHEN’S D – DIFFERENCES BETWEEN MEANS • Standard measure for independent samples t test • Cohen initially suggested could use either sample standard deviation, since they should both be equal according to our assumptions (homogeneity of variance) • In practice however researchers use the pooled variance
COHEN’S D – DIFFERENCES BETWEEN MEANS Relationship to t Relationship to rpb P and q are the proportions of the total each group makes up. If equal groups p=.5, q=.5 and the denominator is d2 + 4 as you will see in some texts
GLASS’S Δ For studies with control groups, we’ll use the control group standard deviation in our formula This does not assume equal variances
COHEN’S D – DIFFERENCES BETWEEN MEANS Relationship to t Relationship to rpb P and q are the proportions of the total each group makes up. If equal groups p=.5, q=.5 and the denominator is d2 + 4 as you will see in some texts
EXAMPLE • Average number of times graduate psych students curse in the presence of others out of total frustration over the course of a day • Currently taking a statistics course vs. not • Data: • Find the pooled variance and sd • Equal groups so just average the two variances such that sp2 = 6.25
DEPENDENT SAMPLES Difference scores Mean difference score divided by the standard deviation of the difference scores
DEPENDENT SAMPLES • The standard deviation of the difference scores, unlike the previous solution, takes into account the correlated nature of the data • Var1 + Var2 – 2covar • Problems remain however • A standardized mean change in the metric of the difference scores can be much different than the metric of the original scores • Variability of difference scores might be markedly different for change scores compared to original units • Interpretation may not be straightforward
DEPENDENT SAMPLES • Another option is to use standardizer in the metric of the original scores, which is directly comparable with a standardized mean difference from an independent-samples design • In pre-post types of situations where one would not expect homogeneity of variance, treat the pretest group of scores as you would the control for Glass’s Δ
DEPENDENT SAMPLES Difference scores Mean difference score divided by the standard deviation of the difference scores
DEPENDENT SAMPLES • The standard deviation of the difference scores, unlike the previous method used for independent samples, takes into account the correlated nature of the data • Var1 + Var2 – 2covar • Problems remain however • A standardized mean change in the metric of the difference scores can be much different than the metric of the original scores • Variability of difference scores might be markedly different for change scores compared to original units • Interpretation may not be straightforward
DEPENDENT SAMPLES • Another option is to use standardizer in the metric of the original scores, which is directly comparable with a standardized mean difference from an independent-samples design • In pre-post types of situations where one would not expect homogeneity of variance, treat the pretest group of scores as you would the control for Glass’s Δ
CASE-LEVEL EFFECT SIZES Cohen’s (1988) measures of distribution overlap: U1 Proportion of nonoverlap If no overlap then = 1, 0 if all overlap U2 Proportion of scores in lower group exceeded by the same proportion in upper group If same means = .5, if all group2 exceeds group 1 then = 1.0 U3 Proportion of scores in lower group exceeded by typical score in upper group Same range as U2
OTHER CASE-LEVEL EFFECT SIZES Tail ratios (Feingold, 1995): Relative proportion of scores from two different groups that fall in the upper extreme (i.e., either the left or right tail) of the combined frequency distribution “Extreme” is usually defined relatively in terms of the number of standard deviations away from the grand mean Tail ratio > 1.0 indicates one group has relatively more extreme scores Here, tail ratio = p2/p1:
OTHER CASE-LEVEL EFFECT SIZES • Common language effect size (McGraw & Wong, 1992) is the predicted probability that a random score from the upper group exceeds a random score from the lower group • Find area to the right of that value • Range .5 – 1.0
ETA-SQUARED • A measure of the degree to which variability among observations can be attributed to conditions • Example: 2 = .50 • 50% of the variability seen in the scores is due to the independent variable.
ETA-SQUARED Relationship to t in the two group setting
OMEGA-SQUARED Another effect size measure that is less biased and interpreted in the same way as eta-squared. Think adjusted R2, where k is the number of groups
CONFIDENCE INTERVALS FOR EFFECT SIZE • Effect size statistics such as Hedge’s g and η2 have complex distributions • Traditional methods of interval estimation rely on approximate standard errors assuming large sample sizes • General form for d is the form for intervals we’ve seen in general
CONFIDENCE INTERVALS FOR EFFECT SIZE Standard errors for hand calculation