Download
1 / 24
650 likes | 1.27k Views
Metallurgy Unit 7: Failure Analysis Fatigue. Refers to the type of failure normally occurring after a lengthy period of repeated stress / strain cycling. Mainly occurs i n structures subjected to dynamic and fluctuating loads.

E N D
Metallurgy Unit 7: Failure Analysis Fatigue
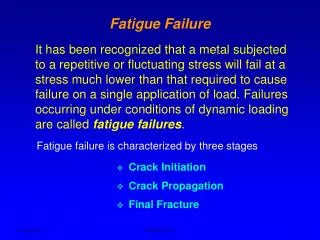
Refers to the type of failure normally occurring after a lengthy period of repeated stress / strain cycling. Mainly occurs in structures subjected to dynamic and fluctuating loads. Cyclic loading causes failure to occur at a stress level considerably lower than the tensile or yield strength for a static load. Fatigue failure comprises 90% of all metallic failures, including polymers & ceramics. Fatigue failure is very disastrous and occurs suddenly without any warning. Common examples are bridges, aircraft, and machine components. Fatigue
CYCLIC STRESSES • Includes axial ( tension - compression), flexural (bending), and torsional (twisting) stresses.
Types of Cyclic Stresses:- • 1. Reversed Stress Cycle:- • Amplitude is symmetrical about a Mean Zero stress level. σmax Tension + σmin O Stress Time Compression
2. Repeated Stress Cycle:- • Maxima and Minima are asymmetrical relative to the Zero Stress Level. σmax σa Tension + σr σmin σm Stress O Time Compression Back
3. Random Stress Cycle:- • Stress level may vary randomly in amplitude and frequency. Tension + O Stress Compression Time
Following parameters are used to characterize the Fluctuating/Repeated Stress Cycle: a) Mean Stress (σm): stress about which the stress amplitude alternates, defined as the average of maximum and minimum stresses in a cycle. σm = σmax +σmin 2 b) Range of Stress (σr) : it is the difference between σmax & σmin. σr = σmax - σmin c) Stress Amplitude (σa): it is one-half of the range of stress. σa = σr / 2 d) Stress Ratio (R):it is the ratio of minimum and maximum stress amplitudes. R = σmin / σmax
FATIGUE TESTING • The fatigue properties of materials can be determined from laboratory simulation tests, by duplicating as nearly as possible the service stress conditions e.g. stress level, time, frequency, stress pattern, etc. • fig. shows a rotating- bending test apparatus, commonly used for fatigue testing. • Tests are conducted using an alternating uni - axial tension- compression stress cycle. • Compression & tensile stresses are imposed on the specimen as it is subsequently • bent and rotated. • Specimen is subjected to cyclic stresses at a large maximum stress amplitude, usually of the order of 2/3rd of static tensile strength. • No. of cycles to failure is counted.
S-N Curve For gradually decreasing maximum stress amplitude, data is plotted as stress S versus the logarithm of No. of cycles to failure (N) for each specimen. Higher the stress, smaller is the no. of cycles to failure.
Two types of S-N behavior are observed: • For ferrous and Titanium alloys, the S-N curve becomes horizontal at higher N values. This is the limiting stress level, called the FATIGUE LIMIT or ENDURANCE LIMIT, below which fatigue failure will not occur. • This represents the largest value of fluctuating stress that will not cause failure for infinite no. of cycles. • For many steels, it ranges b/w 35% to 60% of the tensile strength. Fatigue Limit Stress amplitude, S 103 104 105 106 107 108 109 1010 Cycles to Failure, N (logarithmic scale)
For non- ferrous alloys, the S-N curve continues its downward trend at increasingly greater N values. For such materials, the fatigue response is specified as FATIGUE STRENGTH, the stress level at which failure will occur for specified no. of cycles. • Thus, fatigue will occur ultimately regardless of magnitude of stress. S1 Stress amplitude, S Fatigue strength at N1 cycles Fatigue life at stress, S1 N1 103 104 107 108 109 1010 Cycles to Failure, N (logarithmic scale)
Fatigue behaviour may be classified into two domains:- • 1. Low Cycle Fatigue • Associated with heavy loads that produce elastic strain as well as some plastic strain during each cycle. • Fatigue lives are relatively short. • Occurs at less than about 104 to 105 cycles. • 2. High Cycle Fatigue • Associated with loads producing only elastic strain. • Longer fatigue lives. • Occurs at greater than 104 to 105 cycles.
Fatigue Life (Nf) • It is the number of cycles to cause failure at a specified stress level. • There always occur considerable variation in measured value of N for a number of specimen tested at same stress level. • Variation may lead to significant design uncertainties when fatigue life and fatigue limit are considered. • Variation is due to fatigue sensitivity to a number of test and material parameters such as specimen fabrication and surface preparation, metallurgical variables, specimen alignment in the apparatus, mean stress, test frequency, etc. • A convenient way of representing fatigue life in • terms of probability is shown :- • A series of constant probability curves are plotted. • The P value represents the probability of fatigue • failure at a particular no. of cycles.
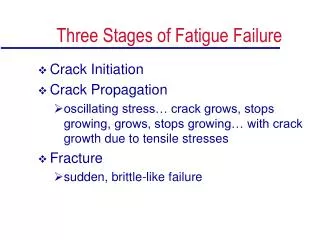
Mechanism of fatigue Fatigue failure is characterized by three steps: Stage I Crack Initiation: Crack forms at some point of high stress concentration Stage II Crack Propagation: Crack advances incrementally with each stress cycle. Stage III Final Failure: Occurs very rapidly once the advancing crack has reached a critical size.
Crack Initiation • Cracks always nucleate at some point of high stress concentration. • Nucleation sites include surface scratches, sharp fillets, keyways, threads, dents, etc. • Microscopic surface discontinuities resulting from dislocation slip steps due to cyclic loading also acts as stress raiser sites. • Crack Propagation • Characterized by two types of markings termed as Beachmarks and Striations. • Both indicate the position of the crack tip and appear as concentric ridges expanding away from the crack initiation site(s). • Beachmarks are of macroscopic dimensions and usually found in components that experienced interruptions during the crack propagation stage. • Fatigue striations are microscopic in size and can be seen with the electron microscope. • Each beachmark represents a period of time over which crack growth occurred. • Eachstriationrepresents the advance distance of a crack front during a single load cycle. • Beachmarks and striations will not appear on the region on which rapid failure occurs.
Fracture surface of a rotating steel shaft (showing beachmarks) that experienced fatigue failure. Transmission electron fractograph showing Fatigue Striations in Aluminium
Crack Propagation Rate The rate at which a crack grows has considerable importance in determining the life of a material. The propagation of a crack occurs during the second step of fatigue failure. As a crack begins to propagate, the size of the crack also begins to grow. The rate at which the crack continues to grow depends on the stress level applied and can be calculated mathematically by the equation ……………………………….. (1) The variables A and m are properties of the material, da is the change in crack length, and dN is the change in the number of cycles. K is the change in the stress intensity factor Rearrangement and integration of eqn. 1 gives us the relation of the number of cycles of failure, Nf, to the size of the initial flaw length, ao, and the critical crack length, ac, and Eq. 2: Note: Nfis an estimate of the number of cycles to failure
Factors affecting Fatigue Life 1. Mean Stress σm3 >σm2 >σm1 It may be noted from the following curves that increasing the mean stress level leads to a decrease in the fatigue life. σm1 Stress amplitude, σa σm2 σm3 Cycles to Failure, N (logarithmic scale)
2. Surface Effects • Usually maximum stress within a component or structure occurs at its surface. • Fatigue life is especially sensitive to the condition and configuration of the component surface. • Design criteria as well as surface treatments influence the fatigue resistance. • Design Factors: • Any notch or geometrical discontinuity including grooves, holes, keyways, threads, etc can act as a stress raiser and fatigue crack initiation site. • Probability of fatigue failure can be reduced by making design modifications i.e. by eliminating sudden contour changes. • e.g. making round fillets with larger radii of curvature at the point where there is change in diameter for a rotating shaft.
Surfaces Treatments: • Small scratches and grooves are introduced in the work piece surface by cutting tool action during machining operation, thus reduces the fatigue life. • Increasing the surface finish by polishing enhances fatigue life significantly. • Another effective method is to nullify the effect of tensile stress of external origin by imposing residual compressive stresses within a thin outer surface layer. • Shot Peeningand Case hardening are some of the most effective methods of increasing fatigue performance. • 3. Environmental Effects • Thermal fatigue and Corrosion fatigue comes under this category. • Thermal Fatigue • Induced at elevated temperatures by fluctuating thermal stresses, mechanical stresses from external source need not be present. • Thermal expansion or contraction due to variation in temperature is mainly responsible for such stresses.
Magnitude of thermal stress is given by • σ = α E ∆T • where, σ – thermal stress • α – coefficient of thermal expansion • E – modulus of elasticity • ∆T – temperature change • Can be reduced only by eliminating the restraint source thus allowing unhindered dimensional changes with temperature changes or by choosing the materials with appropriate physical properties. • Corrosion Fatigue • Occurs by the simultaneous action of a cyclic stress and chemical attack. • Corrosive environments are harmful and produces shorter fatigue lives. • Small pits formed as a result of chemical reaction b/w the material and the environment serve as points of stress concentration. • Crack propagation rate is also enhanced as a result of corrosive environment. • Can be prevented by applying protective surface coatings, using corrosion-resistant materials, reducing the corrosiveness of environment, etc.
Thank You! Presented By: Aashish Bansal MT-1271-2k6
Shot Peening • Commercial method of introducing compressive stresses into ductile metals by plastic deformation within the outer surface region. • Small hard particles (shot) having dia in the range of 0.1 to 1.0 mm are projected at high velocities onto the surface. • Resulting deformation induces compressive stresses to a depth of b/w one- quarter and one-half of the shot diameter. Stress amplitude Shot peened Cycles to Failure (logarithmic scale) Normal Influence of shot peening on the fatigue behavior of steel Back
Case Hardening • Both surface hardness and fatigue life of steel alloys are enhanced by this technique. • Accomplished by Carburizing or Nitriding process • Carbon or Nitrogen rich outer surface layer (case) is introduced by atomic diffusion from the gaseous phase. • The case is about 1mm deep and is harder than the inner core of the material. A case hardened steel gear showing diffusion of Carbon into the material producing a "case" around the gear. Back