Download
1 / 18
180 likes | 318 Views
Interactions between the spatial patterns of tropical forest disturbance and biomass: Results from two studies that use Landsat and forest inventory (FIA) data. E. H. Helmer International Institute of Tropical Forestry, USDA Forest Service Landsat Science Team Meeting January 6-8, 2008

E N D
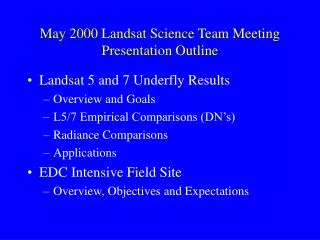
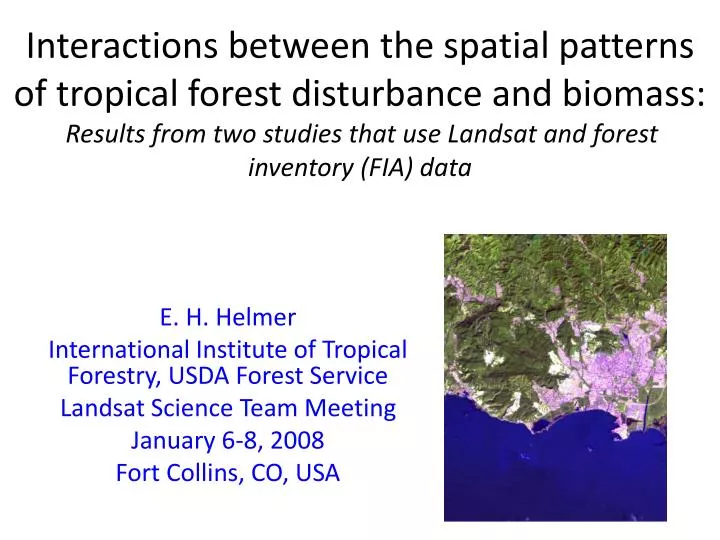
Interactions between the spatial patterns of tropical forest disturbance and biomass:Results from two studies that use Landsat and forest inventory (FIA) data E. H. Helmer International Institute of Tropical Forestry, USDA Forest Service Landsat Science Team Meeting January 6-8, 2008 Fort Collins, CO, USA
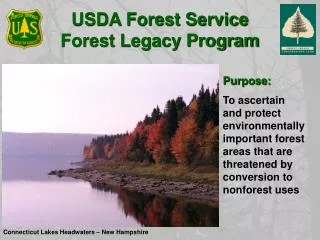
Study 1 – Puerto Rico • Helmer, EH, TJ Brandeis, AE Lugo and T Kennaway. 2008. Factors influencing spatial pattern in tropical forest clearance and stand age: implications for carbon storage and species diversity. Journal of Geophysical Research: Biogeosciences 113: G02S04 • Accounting for tropical forest age yields a 19% smaller estimate of the forest biomass cleared for land development than if forest age is not accounted for
Average FIA forest plots to estimate forest biomass per hectare by: (1) generalized type only (2) both type and age class Sum biomass of forest cleared for land development,comparing the two biomass estimates.
Three econometric models help explain the result • Forest age • Cleared forest age • Forest cleared vs. not cleared (testing if forest age is influential)
Spatially explicit land-use models Ln [ (Pr. Land use A) / (Land use B) ] = β1 + β2X 1…+βnX n Dependent variables are proxies for processes that determine land use at a given place • Human decisions aimed at maximizing land rent • Land accessibility and quality determine land use
e.g. Forest age class Ln [ (Pr. Age classk) / (Pr. Age classj) ] = β1 + β2X 1…+βnX n • Land accessibility and quality determine the spatial pattern of agricultural abandonment over time
Model Results CLEARED FOREST AGE INCREASES WITH… FOREST CLEARING DECREASES WITH… FOREST AGE INCREASES WITH… Surrounding forest cover (decreasing pasture cover) Elevation Slope Road distance Limestone, Serpentine Protection Wetland Proximity to urban1 Surrounding forest cover (decreasing pasture cover) Elevation Slope Road distance Limestone Surrounding forest cover (decreasing pasture cover) Elevation Slope Road distance Protection Wetland Distance to urban Oldest age class2 1The largest protected areas are close to urban centers 2No difference between other ages, implying that the age of cleared forest depends mainly on the spatial pattern of forest age before clearing
Why do the forests cleared for land development have less biomass? • Accessibility, arability and spatial contagion determine 1) the pattern of agricultural abandonment that permits forest regrowth, and 2) where humans leave old-growth forest remnants. • The factors patterning forest age and urban development co-vary, with the result that forests are increasingly younger in more accessible and fertile areas where agriculture has lasted longer and land development is most common.
Study 2 – Virgin Islands • Kennaway, T., E. H. Helmer, M. A. Lefsky, T. A. Brandeis and K. R. Sherrill. 2008. Mapping land cover and estimating forest structure using satellite imagery and coarse resolution lidar in the Virgin Islands. Journal of Applied Remote Sensing 2:023551. • The same forest formations mapped from Landsat imagery can have 18% to 86% more biomass in largely protected landscapes (Kennaway et al. 2008, J. Applied Rem. Sens.)
Pan-sharpened cloud-free image mosaics from regression tree normalization can be used to map tropical forest types and land cover Mosaic from regression tree normalization of 30-m optical bands The 30-m mosaic pan-sharpened with a regression-tree normalized mosaic of the 15-m panchromatic band Landsat bands 5, 4, 3 (R, G, B) for part of St. John, USVI
Lidar height and biomass summarized by land-cover classification T. Kennaway, Feb 2008 T Kennaway, EH Helmer, MA Lefsky, KR Sherrill, TJ Brandeis. 2008. J. Applied Rem. Sens.
Lidar to map forest height/biomass • Leica ALS 40 sensor with multiple return data • Vertical Root Mean Square Error of 9.26 cm • Point cloud data with 2.76 m shot spacing T Kennaway, EH Helmer, MA Lefsky, TJ Brandeis, KR Sherrill. 2008. J. Applied Rem. Sens.
Predicted Map (Height/Biomass) T. Kennaway, Feb 2008 T Kennaway, EH Helmer, MA Lefsky, KR Sherrill, TJ Brandeis. 2008. J. Applied Rem. Sens.
The biomass of major forest types on largely protected St. John is 18% to 86% larger than the same types on largely unprotected St. Thomas T Kennaway, EH Helmer, MA Lefsky, TJ Brandeis, KR Sherrill. 2008. J. Applied Rem. Sens.