Download
1 / 56
560 likes | 685 Views
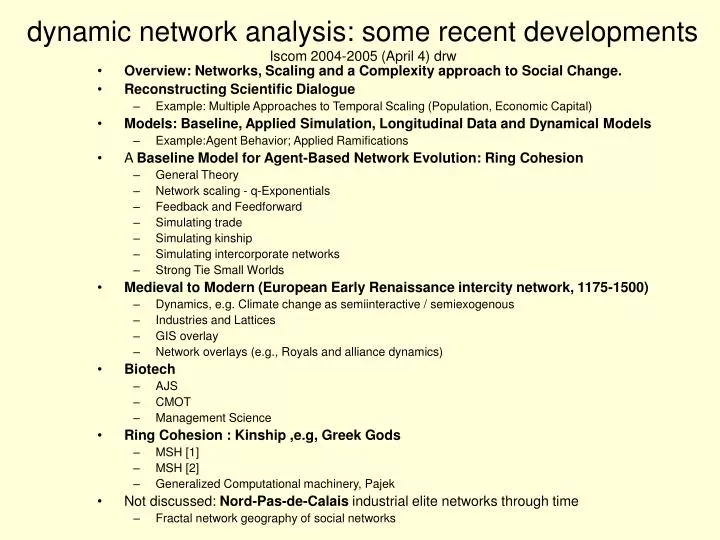
dynamic network analysis: some recent developments Iscom 2004-2005 (April 4) drw. Overview: Networks, Scaling and a Complexity approach to Social Change. Reconstructing Scientific Dialogue Example: Multiple Approaches to Temporal Scaling (Population, Economic Capital)

E N D
dynamic network analysis: some recent developments Iscom 2004-2005 (April 4) drw • Overview: Networks, Scaling and a Complexity approach to Social Change. • Reconstructing Scientific Dialogue • Example: Multiple Approaches to Temporal Scaling (Population, Economic Capital) • Models: Baseline, Applied Simulation, Longitudinal Data and Dynamical Models • Example:Agent Behavior; Applied Ramifications • A Baseline Model for Agent-Based Network Evolution: Ring Cohesion • General Theory • Network scaling - q-Exponentials • Feedback and Feedforward • Simulating trade • Simulating kinship • Simulating intercorporate networks • Strong Tie Small Worlds • Medieval to Modern (European Early Renaissance intercity network, 1175-1500) • Dynamics, e.g. Climate change as semiinteractive / semiexogenous • Industries and Lattices • GIS overlay • Network overlays (e.g., Royals and alliance dynamics) • Biotech • AJS • CMOT • Management Science • Ring Cohesion : Kinship ,e.g, Greek Gods • MSH [1] • MSH [2] • Generalized Computational machinery, Pajek • Not discussed: Nord-Pas-de-Calais industrial elite networks through time • Fractal network geography of social networks
focus on network dynamics in empirical and simulated data differentiate network models of temporal processes according to several distinctions • 1.Baseline models, applied simulation models and empirical models. • 2.Long-term data is not a longitudinal dataset and a longitudinal dataset does not constitute a dynamic, or a dynamical view of a process. Longitudinal implies that long-term data are cast into a framework for valid and linked comparison (e.g., tracking the same elements through time) and measuring change as well as static variables. Dynamical implies a model of the process generating change, or, for that matter, statis (e.g., self-canceling changes for a process at equilibrium). • 3. Nondegenerate and degenerate network dynamics. The difference can be illustrated by the relation of two variables in the phase space of the phenomena, whether simulated or observed. In the degenerate case the two variables e, z are related in a way that does not predict a change variable ż from the state variables by some function ż = f(e,z). In a fully nondegenerate case such predictions can be made for both change variables. Similarly for larger sets of variables. In a simple Lotka-Voltera model for e chasing z and z chasing e, in a predator/prey model, for example, ż = f(e,z) and ė = f(e,z).
Models • Baseline, Applied Simulation (trade; biotech; marriage; other networks), Longitudinal Data and Dynamical Models • Baseline example:Agent behavior by node <s> in network N, modifying N P(N´) = P(<s>|N, S, SP) x (P(<s,t Є N>|s, N, S, SP) + P(<s,t ¢ N>)) i.e. P(t Є N) + (1-P(t ¢ N) asynchronous update of N´ for selected <s> selection of agent <s> proportional to degree kα of s. selection of traversal of the agent’s token to <t> at an integer distance dfrom <s> proportional to dβ, with d > 1. [agent tries to find a target via a token] selection of each intermediate v from prior u in s-t path proportional to vγ. Probability of network N´ within a class of networks formed from an existing N by addition of a new edge from target node <t> to agent <s> either within N or adding t to N, conditioned on structural properties of N in the set S, e.g., S={K,D,V}=degrees k of <i>, distances d of <s,t> and traversal properties of s,…,u,v,…,t, adding exponential influence parameters on S in set SP ={kα,dβ,vγ},
Models, baseline Example:Agent Behavior by node <s> within network N In this example the interaction variables and their influence parameters SP ={kα,dβ,vγ} correspond to activity of an agent ~ kα, the potency ~ dβ of the agent’s (token) communication and the strategy~vγused in token traversal, in which γ > 0 depends on the intelligence of average nodes in the network as intermediaries in the transmission of tokens in search of targets. Interpretations: In general, an agent sustains itself by a search, first, for a potential target t or partner with whom feedback is established within an existing network, and, failing that, with a new partner t Field properties: we look as distributions that asymptotically converge as the asynchronous iterations ∞. The convergent field processes are brought back to make conceptual comparisons with processes observed through time in smaller networks.
Models, baseline Example:Agent Behavior by node <s> within network N A selected agent s sustains itself by a search, first, for a potential target t or partner with whom feedback is established within an existing network, and, failing that, by recruiting and connecting to a new node t that serves as a resource activity of an agent ~ kα, potency ~ dβ of the agent’s (token) communication strategy~vγused in token traversal, in which > 0 depends on the average intelligence of average nodes in the network as intermediaries in the transmission of tokens in search of targets. • Applied Ramifications: Interpretations in specific examples, 1 Interorganization ties in the biotech industry 2 Evolution of city networks in the Early European Renaissance 3 Emergence of coherent social units (class, ethnicity, industry cores and scaffolds), including processes such as marriage P(N´) = P(<s>|N, S, SP) x (P(<s,t Є N>|s, N, S, SP) + P(<s,t ¢ N>)) consolidation novelty
N=250 Edges weighted by traversals forming feedback cycles α=0 γ=1 α=0 γ=0 Right (γ=1), etched routes Distance decay β =1.3 Left (γ=0), more novelty α=1γ=1 α=1 γ=0 Lower (α=1), clustered
N=250 Nodes weighted by degree α=0 γ=1 α=0 γ=0 Distance decay β =1.3 Left (γ=0) ~ fewer cycles Right (γ=1) ~ road circuitss α=1γ=1 α=1 γ=0 Lower (α=1) ~ airline hubs
networks and scaling q-entropy (C. Tsallis) provides an accounting system for potential and kinetic energies for both independent q=1 and nonindependent q≠1 interactions. Cycle formation is produced by nonindependent probabilities: a final <v,u> link to complete a cycle depends on a preexisting u-v path. For a baseline network model of agency, with continuous probabilities, ought to have distributions that are q-entropic and scale-free in q-entropic (log-q-log) measures. Conjecture: Network dynamics will satisfy the laws of thermodynamics measured by q-entropy, i.e., the study of the inter-relation between heat, work and internal energy of a system, for independent and nonindependent interactions, 0 When two systems are in thermal equilibrium with a third body (like a thermometer), they are also in thermal equilibrium (identical q-entropies) with each other 1 Energy can be changed from one form to another (heat, work and internal energy), but it cannot be created or destroyed 2 In all energy exchanges, if no energy enters or leaves the system, the potential energy of the state will always be less than that of the initial state (q-entropy nondecr) 3 The entropy of a perfect crystal at 0° K is zero For many self-organizing systems, adaptive feedback (selection / intention) takes place through cycle formation, while feed-forward occurs through storage (etching) of traversal frequency as potential energy or information source for future dynamics. Theory of Ring Cohesion provides a structural accounting system for decomposing feedback into agent-based behavioral generators
Simulations: For α=1, β and γ make little difference, but as α 0 the log-log scale-free degree distributions almost always shift to q-exponential. In a generalized q-log-log scale these are all scale-free. q=1.21 q=1.38 q=2.10 q=1.08 q=1.20 q=1.65 q=1.16 q=1.31 q=1.85 q=1.16 q=1.42 q=2.90
Simulations: All these distributions fit the q-exponential. For a given γ, α and β make little difference to the q-exponential, but as γ 0, the distributions shift to a decreasing concentration potential. γ 1 has greater concentration potential
from growth models to dynamics a more general model incorporates decline along with growth S = (k, d, dist, Ai,j and Aj,i) has added structural measures and the associated influence parameters expand to SP = (α, β, γ, δ, ε) where α, β, γ are defined as before (for k,d,v) and two new influence parameters govern the probability bias on the deletion of a node or an edge: selection of agent <s> for deletion proportional to degree kα of s, with δ pos. or neg; alternatively, age specific mortality. selection of edge <u,v> for deletion proportional to reciprocal edge weight (Auv * Avu)ε, ε pos. or neg. This model is capable of (mild) oscillatory dynamics that can be amplified by cascade effects such as produced by structural cohesion (meso-level network effects)
Feedback and feed forward • Feedback is represented explicitely in the network agent model: suggests that a replicator dynamic might weight the replicative success of agents by the number of incoming feedback cycles. • The non-feedback edges, however, represent new resources or sources of novelty. • What is required for novelty to generate innovation, however, is consolidation/reorganization. Replicator dynamics (RD) might incorporate • RD = f (feedback inputs, new ties, pairwise reciprocity resulting from traversals, independent of agent objectives, nonindependent cycles such as generalized reciprocity, and emergent higher order organization). Ways in which directedness, e.g., may get washed out.
Higher order interactions • Why needed? The dynamic oscillations and tipping points of observed network interactions (trade, biotech, social networks) are more exaggerated than the more continuous network evolution models that add decay in small perturbations. Are these random exogenous shocks or endogenous network processes? • Statistical analysis of new tie formation shows that structurally cohesive aggregates have effects independent of the micro attribute predictions
dynamic role of structural cohesion • A hierarchical embedded structuration with potentials for intersections and organizations-in-fields crossovers. • Biotech: structural cohesion provides the measure of level of multiconnectivity in a cohesive core with a new tie and novelty/consolidation dynamics. • Marriage networks that define social class, ethnicity, wealth and knowledge transition show similar patterns, as do trade networks. • The consolidation processes of interaction in which significant reorganization accomodates innovation are likely to occur within structurally cohesive emergent units, e.g., David Lane’s recursive “new attributions of functionality” and “forming new attributions.” Bootstrapping proceses (Anderson 1972). • As cohesive level goes up, by definition, size at that level goes down in an intensifying shrinkage of reorganization. Cohesive intensification in and of itself is thus also likely to be exclusionary and potentially stultifying to further innovation.
Higher order interactions: how do cohesive units emerge? • Here is where feed-forward processes operate on networks, because the etchings of traversal frequencies create a mechanism for information storage that influences future behavior through agent perceptions (perceivable structures) • Do these provide the endogenous network processes needed to understand the dynamic oscillations and tipping points of observed network interactions (trade, biotech, social networks) that are more exaggerated than the more continuous network evolution models that add decay in small perturbations.
Cohesive nodes (gold and red) in an expanded exchange network and further road identification (red=3-cohesive) shows a second cohesive accumulation center further to the east -- again, such cohesion supported the creation of wealth among merchants and merchant cities, with states supported by indirect taxation and loans. Red 3-components Middle East and its 3-core not sampled Now Northern Europe is represented (and the locations are geographic): the main Hanseatic League port of Lubeck had about 1/6th the trade of Genoa, 1/5th that of Venice.
Betweenness Centralities in the banking network (Net 6) Betweenness centrality in the trade network ought to predict accumulation of mercantile wealth. Genoa has greatest wealth, as predicted. On September 7th 1298 Genoa defeated the Venetian fleet in battle. Size of nodes adjusted to indicate differences in betweenness centrality of trading cities
(Net 7) Flow centrality (how much total network flow is reduced with removal of a node) predicts something entirely different: the potential for profit-making on trade flows. It necessarily reflects flow velocities central to the organizational transformations undergone in different cities, as Spufford argues. This type of centrality is conceptually very difference and distributes very differently than betweenness and strategic centers like Venice or Genoa, which are relatively low in flow centrality.
(database now expanded to 299 cities) (Net3) Productivities are overlapping, crosscutting and interlaced in complex ways
(Net3) Productivities are overlapping, crosscutting and interlaced in complex ways Note how an industrial "blue banana" construction is taking place with communications in the left column, art works in the middle and linens on the left, i.e., circulation among the NW-SE poles; while capitals show a political vacuum of smaller polities in between, and trade fairs fill in this vacuum by providing decentralized marketing institutions.
(Net3) Productivities are overlapping, crosscutting and interlaced in complex ways
2005Iscom_Italy D. R. White 2005 Engines of History Innovation and Consolidation PopPressure, Destruction, Cumulativity
… including power-law growth of world population. • Before we go there, it helps to know that all power-law growth entails strong predictions from its singularity date (in this case 2030 ± 10) as the outer limit of sustained growth: • It necessitates a transition before singularity • (2) It predicts cycles of diminishing length as singularity approaches In millions, actual and trend And if we take the departure from the trend to define cycles of change we can begin to study other changes …
Detrended as a percentage of prior population …we see cycles of population growth Source: White et al. Detrended World Population to 1800, in millions
Reconstructing Scientific Dialogue: iscom-referential eJournal communities, e.g., Structure & Dynamics, MBS • Dialogic • Review community • Commentary, Reply, Replication Example: Understanding Dynamics • Interaction models: classes of functions ż =f(a,b,c…) • Functions vs. exploring potential phase spaces • Measuremt. & experimental testing of unexplored spaces • Testing interactive dynamics vs. defects of curve fitting Example: Multiple Approaches to Temporal Scaling • Population • Economic Capital Example: Networks, Mesolevels, Scaffordings, etc. • Iscom issues
Engine process: Territorial States e.g., run by inputs of popPressure and competition, outputs of Innovation (increase with size) falling population (innovations conserved) T= isolation competition transport Internal Conflict (innovations) Pop Density/Resources P=Pop Pressure
This is Turchin's phase diagram for England, 1480-1800, for population size and sociopolitical violence as a pair of variables that drive one another interactively. Temporal movement here is clockwise (axes are reversed from the previous diagram). The dynamic is that the population reaches carrying capacity setting sociopolitical violence into play, which only recedes as population crisis leads to a collapse, leading into a new cycle. ‘Temperature’ Where you are on this phase diagram predicts where you are going; this is not true for synchronouslycorrelated variables ‘Pressure’
English sociopolitical violencecycles don’t directly correlate but lagpopulation cycles. Detrended English population cycles, 1100-1900, occur every 300-200 years. Source: Turchin
Turchin tests statistically the interactive prediction versus the inertial prediction for England
Detrended Populations: World (logged) (power law) and England Source: White et al. Cycles grow shorter as predicted by power-law growth. England’s population cycles lag the World cycles, which are heavily weighted by China and India
Correlates that do not interact dynamically include: Inflation cycles (English: David Hackett Fischer) imitate Detrended EnglishPopulation cycles (Turchin) Renaissance Equilibrium (begins with economic depression) 1900
Effects of Inflation of Land on Monetization The population and sociopolitical crisisdynamic that drove Inflation also drove monetization and trade in luxury goods in the 12th-15th centuries. Inflation of land valuecreatedmigration of impoverished peasantsejected from the land, demands of money rents for parts of rural estates, and substitution of salaries for payments in land to retainers,
Engine processes e.g., carnot cycles, run by inputs of fuel and energy, outputs of momentum and exhaust; mechanically linked decompression (momentum conserved) T exhaust firing piston (momentum) compression P
Engine process: Biotech e.g., run by inputs of cohesion and novelty, outputs of innovation & distribution outside recruitment (novelty) (innovation conserved) T= internal production couplings Intra distribution Org. (innovation) Exchanges cohesion P= Cohesive Consolidation of Field
Cumulative ties, Biotech Flip these back and forth for sense of dynamics
New ties/Partner versusCore cohesion (Biotech) time lags 1 & 2 yrsPhase Diagram: New ties to partners ratio Interactive dynamics between innovation and consolidation (new ties dense cores) Percent organizations in top k-component (4, 5, 6) Cores get more cohesive ( smaller) with time; “high metabolism” “more compact” Geoff’s scaling laws
(New ties for 1989) Tree Ties (1990) Tree Ties (1991) Lots of Tree Ties 1992 Core Reinforcement
1992 Core Reinforcement Expanded Core Reinforcement
Densified Core and Tree Ties Expanded Core Reinforcement Densified Core Reinforcement
Densified Core Reinforcement Tree Ties Visually, we see in these last slides over 12 years a repetitive or cyclical dynamic with 3-year cycleing: new tie tree formation (reachout) for two years running, but in the third year of each cycle – new ties regroup to consolidate cohesion in the core. Core reinforcement ratchets up to expanded core and then densified core. These are the same patterns shown in the statistical analysis.
Field processes • After a field influx of recruitment novelty (absorbed into cohesive production) and new recruitment falls to a minimum, it still takes one year for the field to reorganize a more cohesive core • Takes two years for positive effects of a more cohesive core to decay so as to require influx of novelty through recruitment
From phase transitions to Geoff’s scaling laws? • The new animals (corporate cores emergent megacorporations) • Encode elements of more dispersed lower-density systems (e.g., territorial) • But now shrunk into a condensed and ‘high metabolism’ form • Higher ‘productivities’ • From bigger brutes to smaller powerhouses? • One, but not the only way to evolve
Now look at R&D: Biotech e.g., run by inputs of cohesion and novelty, outputs of innovation & distribution outside recruitment (novelty) (innovation conserved) T= internal production couplings Intra distribution Org. (innovation) Exchanges cohesion P= Cohesive Consolidation of Field
New ties to partners ratio Interactive dynamics between innovation and consolidation (new ties dense cores) Percent organizations in top k-component (4, 5, 6) R&D Should hit along with shifts of consolidation because these are noticeable and create excitement, and diffusion out of the core is maximum.
Now look at R&D (incomplete) • Look at whether the fluctuations in R&D ties match the predictions or fit in some other way into the dynamics (R&D/Finance data below for 3 years prior to date shown. VC siphoned off to eComm with internet bubble that started in 1995. • Need the yearly data