Download
1 / 39
390 likes | 497 Views
MIS 385/MBA 664 Systems Implementation with DBMS/ Database Management. Dave Salisbury salisbury@udayton.edu (email) http://www.davesalisbury.com/ (web site). Objectives. Definition of terms Reasons for information gap between information needs and availability

E N D
MIS 385/MBA 664Systems Implementation with DBMS/Database Management Dave Salisbury salisbury@udayton.edu (email) http://www.davesalisbury.com/ (web site)
Objectives • Definition of terms • Reasons for information gap between information needs and availability • Reasons for need of data warehousing • Describe three levels of data warehouse architectures • Describe two components of star schema • Estimate fact table size • Design a data mart • Develop requirements for a data mart
Definition • Data Warehouse: • A subject-oriented, integrated, time-variant, non-updatable collection of data used in support of management decision-making processes • Subject-oriented: e.g. customers, patients, students, products • Integrated: Consistent naming conventions, formats, encoding structures; from multiple data sources • Time-variant: Can study trends and changes • Nonupdatable: Read-only, periodically refreshed • Data Mart: • A data warehouse that is limited in scope
History Leading to Data Warehousing • Improvement in database technologies, especially relational DBMSs • Advances in computer hardware, including mass storage and parallel architectures • Emergence of end-user computing with powerful interfaces and tools • Advances in middleware, enabling heterogeneous database connectivity • Recognition of difference between operational and informational systems
Need for Data Warehousing • Integrated, company-wide view of high-quality information (from disparate databases) • Separation of operational and informational systems and data (for improved performance)
Issues with Company-Wide View • Inconsistent key structures • Synonyms • Free-form vs. structured fields • Inconsistent data values • Missing data • cf. Figure 11.1
Organizational Trends Motivating Data Warehouses • No single system of records • Multiple systems not synchronized • Organizational need to analyze activities in a balanced way • Customer relationship management • Supplier relationship management
Data Warehouse Architectures • Generic Two-Level Architecture • Independent Data Mart • Dependent Data Mart and Operational Data Store • Logical Data Mart and Real-Time Data Warehouse • Three-Layer architecture • All involve some form of extraction, transformation and loading (ETL)
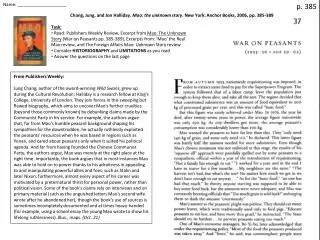
L One, company-wide warehouse T E Periodic extraction data is not completely current in warehouse Generic two-level data warehousing architecture
Data marts: Mini-warehouses, limited in scope L T E Separate ETL for each independent data mart Data access complexity due to multiple data marts Independent data mart data warehousing architecture
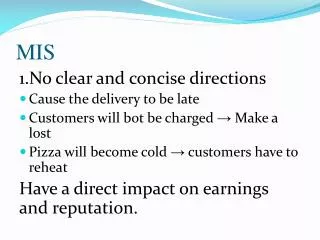
ODS provides option for obtaining current data L T E Simpler data access Single ETL for enterprise data warehouse (EDW) Dependent data marts loaded from EDW Dependent data mart with operational data store: a three-level architecture
Logical data mart and real time warehouse architecture ODS and data warehouse are one and the same L T E Near real-time ETL for Data Warehouse Data marts are NOT separate databases, but logical views of the data warehouse Easier to create new data marts
Data CharacteristicsStatus vs. Event Data Status Event = a database action (create/update/delete) that results from a transaction Status
Data CharacteristicsTransient vs. Periodic Data With transient data, changes to existing records are written over previous records, thus destroying the previous data content
Data CharacteristicsTransient vs. Periodic Data Periodic data are never physically altered or deleted once they have been added to the store
Other Data Warehouse Changes • New descriptive attributes • New business activity attributes • New classes of descriptive attributes • Descriptive attributes become more refined • Descriptive data are related to one another • New source of data
Derived Data • Objectives • Ease of use for decision support applications • Fast response to predefined user queries • Customized data for particular target audiences • Ad-hoc query support • Data mining capabilities • Characteristics • Detailed (mostly periodic) data • Aggregate (for summary) • Distributed (to departmental servers)
Star schema • Most common data model for data marts (also called “dimensional model”) • Fact tables contain factual or quantitative data • Dimension tables contain descriptions about the subjects of the business • Dimension tables are denormalized to maximize performance • 1:N relationship between dimension tables and fact tables • Excellent for ad-hoc queries, but bad for online transaction processing
Fact tables contain factual or quantitative data Dimension tables are denormalized to maximize performance 1:N relationship between dimension tables and fact tables Dimension tables contain descriptions about the subjects of the business Star schema components
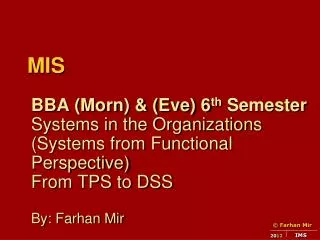
Fact table provides statistics for sales broken down by product, period and store dimensions Star schema example
Issues Regarding Star Schema • Dimension table keys must be surrogate (non-intelligent and non-business related), because: • Keys may change over time • Length/format consistency
Issues Regarding Star Schema • Granularity of Fact Table–what level of detail do you want? • Transactional grain–finest level • Aggregated grain–more summarized • Finer grains better market basket analysis capability • Finer grain more dimension tables, more rows in fact table
Issues Regarding Star Schema • Duration of the database–how much history should be kept? • Natural duration–13 months or 5 quarters • Financial institutions may need longer duration • Older data is more difficult to source and cleanse
Fact table can get huge (monstrous) • Depends on the number of dimensions and the grain of the fact table • Number of rows = product of number of possible values for each dimension associated with the fact table • For example, take Figure 11.11 • Assume only half the products record sales for a given month, the total rows would be calculated as: • 1000 stores X 5000 active products X 24 months = 120,000,000 rows (yikes!)
Modeling dates Fact tables contain time-period data Date dimensions are important
Variations of the Star Schema • Multiple Facts Tables • Can improve performance • Often used to store facts for different combinations of dimensions • Conformed dimensions • Factless Facts Tables • No nonkey data, but foreign keys for associated dimensions • Used for: • Tracking events • Inventory coverage
Normalizing Dimension Tables • Multivalued Dimensions • Facts qualified by a set of values for the same business subject • Normalization involves creating a table for an associative entity between dimensions • Hierarchies • Sometimes a dimension forms a natural, fixed depth hierarchy • Design options • Include all information for each level in a single denormalized table • Normalize the dimension into a nested set of 1:M table relationships
Slowly Changing Dimensions (SCD) • Need to maintain knowledge of the past • One option: for each changing attribute, create a current value field and many old-valued fields (multivalued) • Better option: create a new dimension table row each time the dimension object changes, with all dimension characteristics at the time of change
The User Interface Metadata(data catalog) • Identify subjects of the data mart • Identify dimensions and facts • Indicate how data is derived from enterprise data warehouses, including derivation rules • Indicate how data is derived from operational data store, including derivation rules • Identify available reports and predefined queries • Identify data analysis techniques (e.g. drill-down) • Identify responsible people
On-Line Analytical Processing Tools • The use of a set of graphical tools that provides users with multidimensional views of their data and allows them to analyze the data using simple windowing techniques • Relational OLAP (ROLAP) • Traditional relational representation • Multidimensional OLAP (MOLAP) • Cube structure • OLAP Operations • Cube slicing–come up with 2-D view of data • Drill-down–going from summary to more detailed views
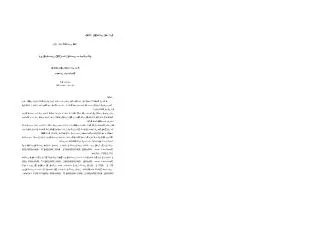
Summary report Drill-down with color added Example of drill-down Starting with summary data, users can obtain details for particular cells
Data mining & visualization • Knowledge discovery using a blend of statistical, AI, and computer graphics techniques • Goals: • Explain observed events or conditions • Confirm hypotheses • Explore data for new or unexpected relationships
Data mining & visualization • Techniques • Statistical regression • Decision tree induction • Clustering and signal processing • Affinity • Sequence association • Case-based reasoning • Rule discovery • Neural nets • Fractals • Data visualization–representing data in graphical/multimedia formats for analysis