Download
1 / 55
640 likes | 959 Views
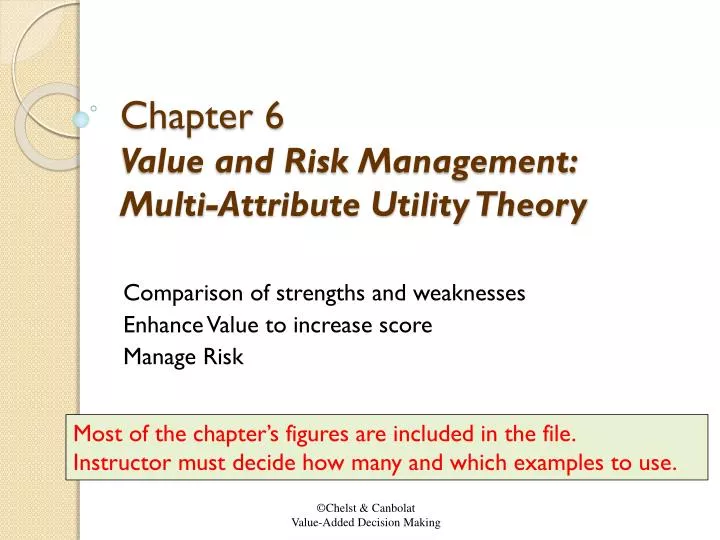
Chapter 6 Value and Risk Management: Multi-Attribute Utility Theory. Comparison of strengths and weaknesses Enhance Value to increase score Manage Risk. Most of the chapter’s figures are included in the file. Instructor must decide how many and which examples to use.

E N D
Chapter 6 Value and Risk Management:Multi-Attribute Utility Theory Comparison of strengths and weaknesses Enhance Value to increase score Manage Risk Most of the chapter’s figures are included in the file. Instructor must decide how many and which examples to use.
Steps in Analysis • Check for data errors • Inputs • Ranges and preferences • Analysis of uncertainty, strengths, and weaknesses • Robustness of optimal - weights change • Value Added and Hybrid • Improve values of highly weighted objective • Reduce risk
Best Lighting System Max Light Quality Amount of Light 1.000 0.534 0.274 Dimmable 0.055 Type of Light 0.205 Min Cost Operating 0.356 0.219 Purchase 0.137 Min Hassle Change Bulbs 0.110 0.110 Figure 6.2: Objectives Hierarchy – High Ceiling Kitchen Fixtures
Errors in Input – Check Ranking Results Graph • Symptom 1 – One line goes above 1 or below 0 • Data input error in that alternative – too large or too small added a zero or left off a zero • Set range too narrow to include all values • Symptom 2 – All lines on one measure outside range • Forgot to reset range on that measure. LDW uses default range of 0 to 1. • Symptom 3 – Ranking of all alternatives on a measure seems upside down • Most preferred and least preferred settings are reversed.
Figure 6.3: Ranking results graph for lighting system example – data input error (figure corrected from text) 1.000 Utility 0.000 Best Lighting System Amount of light Operating Type of light Purchase Change bulbs Dimmable 65 watt basic 75 Halogen Dim 75 Fluorescent Dim 65 Fluorescent 75 watt basic
Figure 6.4: Wrong direction on operating cost measure – reversed Fluorescents should have best operating costs and not worst (near 0)
Figure 6.5: Results graph for lighting system example (figure corrected from text) 1.000 Utility 0.000 Best lighting Max. quality Min. cost Min. hassle 75 Halogen Dim 75 Fluorescent Dim 75 watt basic 65 Fluorescent 65 watt basic
Figure 6.5: Results graph for lighting system example – ERROR in GRAPH - Replace 1.000 Utility 0.000 Best Lighting Max. Quality Min. Cost Min. Hassle 75 Watt Fluoro Dim 65 Watt Fluoro 75 Halogen Dim 75 Watt Basic 65 Watt Basic
Ranking for Best Lighting System Goal Alternative Utility 75 Halogen Dim 0.618 75 Fluorescent Dim 0.584 75 watt basic 0.542 65 Fluorescent 0.526 65 watt basic 0.359 Max Light Quality Min Cost Min Hassle Figure 6.6: Objective (3) stacked bar results for lighting system example
Ranking for Best Lighting System Goal Alternative Utility 75 Halogen Dim 0.618 75 Fluorescent Dim 0.584 75 watt basic 0.542 65 Fluorescent 0.526 65 watt basic 0.359 Amount of Light Operating Type of Light Purchase Change Bulbs Dimmable Figure 6.7: Measure (6) stacked bar results for lighting system
Figure 6.8: Pairwise comparison between the 75-watt halogen and equivalent fluorescent
Figure 6.9: Sensitivity analysis for weight placed on Amount of Light => NOT sensitive
Figure 6.10: Sensitivity to weight placed on Type of Light Sensitive to decrease
Figure 6.11: Sensitivity to weight placed on Operating Cost Sensitive to increase
The Best Alternative So FarMay NOT Be The Final Answer: Values • Enhance best alternative(s) or create better Hybrids through: Value Analysis & Management • Enhance Best or 2nd beat Alternative • Identify a highly weighted but weak measure level in the best alternative(s). • Creatively identify a way to improve the alternative’s measure level and specify associated changes in other measure levels such as added cost. • Hybrid: combine two alternatives in a way that builds on the strengths of the best alternatives. • Evaluate the newly formed alternatives.
Create a Lighting Hybrid • In best solution identify a weak measure with significant weight • Operating cost - weight 0.22 • Creative alternative: 50-50 • High quality light where needed – half of kitchen • Fluorescent with lower cost where true color quality does not matter
Rankin for Best Lighting System Goal Alternative Utility 75 Halogen Hybrid 0.640 75 Halogen Dim 0.618 75 Fluorescent Dim 0.584 75 Watt basic 0.542 65 Fluorescent 0.526 65 Watt basic 0.359 Max Light Quality Min Cost Min Hassle Figure 6.12: Ranking – Hybrid Lighting System: 50-50 split in kitchen – Reduce operating cost
The Best Alternative So FarMay NOT Be The Final Answer: Values • Enhance best alternative(s) or create better Hybrids through: Value Analysis & Management • Enhance Best or 2nd beat Alternative • Identify a highly weighted but weak measure level in the best alternative(s). • Creatively identify a way to improve the alternative’s measure level and specify associated changes in other measure levels such as added cost. • Hybrid: combine two alternatives in a way that builds on the strengths of the best alternatives. • Evaluate the newly formed alternatives.
Alternative Utility Build Rite 0.651 Quality Build 0.630 Cost Conscious 0.462 Max. Quality Min. Cost Min. Hassle Figure 6.13: Stacked bar ranking for kitchen remodeling example
Kitchen remodeler - Data Chapter 5
Enhance 2nd best – Best on CostSpend a little more money and improve • In 2nd best solution identify a weak measure with significant weight that can be improved • Fit and finish (0.12 weight) • Cleanliness and percent use of contractors (minor) • Creativity and References can NOT be improved • Creative alternative: Spend money to improve fit and finish (and other benefits) • Less subcontracting • Cleaner
Alternative Utility Quality Build + Value Enhancement 0.678 Build Rite 0.651 Quality Build 0.630 Max. Quality Min. Cost Min. Hassle Figure 6.15: Stacked bar results after value enhancement: kitchen remodeler
The Best Alternative So FarMay NOT Be The Final Answer: Risks • Enhance best alternative(s) through: Risk Analysis & Management • Identify a highly weighted measure with significant uncertainty in the best alternative(s). • Assess the impact on the MUF of reducing downside risk on that measure. • Develop a strategy for reducing the downside risk even if it changes other measure levels. • Evaluate any newly formed alternatives.
Value Analysis & Risk Management Conformal Coating Process – Printed Boards Global Electronic will install a new conformal coating process because the upcoming Powertrain Control Module (PCM) design requirements are incompatible with the existing coating process at the plant. These coatings are applied to the printed wiring boards to protect circuitry from environmental exposure after the installation of all surface mount devices, but before final assembly of the module. The process should ideally be capable of selectively applying the coating to various areas of the circuit board, coating some areas while avoiding others. Pre-screening of a wide variety of available processes has reduced the number of viable candidates to three. The team realized that these processes vary widely in ability to accommodate design changes (flexibility), weight, initial investment costs, material costs, etc.
Goals Hierarchy & Weights:Coating Process Selection Select Best Coating Process (1.000) Performance (0. 213) Reliability (0.315) Cost (0.324) Time (0.148) Flexibility (0.157) Weight (0.056) Development Time (0.148) Coating Control (0.130) Foreign Material (0.185) Facilities & Tooling (0.093) Material (0.167) Scrap (0.028) Labor (0.037)
Coating Process: Development Time Uncertainty (Risk) Chapter 6
Alternatives & Data: Coating ProcessRed cells illustrate expected value of probabilistic data Chapter 6
Results: Coating Process Selection • Selective Spray: most preferred alternative • Best alternative affected by uncertainty. • Sil-Gel a close second: 7% less • At the extreme it may be better than the best. • Development time involves significantly more uncertainty in the best alternative (Selective Spray) than for the 2nd best Chapter 6
FOCUSHybrids: Both Risk and Value Management • Risk Management • Significant uncertainty in development time of best alternative • Invest $40,000 to eliminate risk of unusually long PD time • Value Management • Coating Control is a weakness of the highest ranked alternative • Invest $60,000 to improve coating control reduce scrap • Risk and Value Management • Create hybrid that combines both risk and value management • Slightly improved overall score • Dramatically reduce chance of lower performance.
Risk Management: Coating Process Selection • Global Electronic contacted the Selective Spray supplier to reduce uncertainty in development time. The supplier asked $40000 more for tooling premiumto work overtime and reduce development time to a range of 28 weeks to 32 weeks. OLD NEW Chapter 6
Risk Management Coating Process Selection (Cont.) • $40000 more investment reduces uncertainty significantly • Amount added to the Facilities and Tooling Cost of new alternative. • Overall average score only slightly improved but less downside risk • Selective Spray + Risk Mng. is the best alternative Chapter 6
Hybrid Alternative Through Value & Risk Management • The Selective Spray supplier can not reduce facilities and tooling cost, or labor cost • The supplier asks $60000 to upgrade coating application nozzles that • Improve coating control from 0 to 1 • Coating control provides an assessment of the process’ ability to apply coating where it is needed, as well as preventing coating bleed into undesirable areas of the printed wiring boards. • 0: Problem areas may affect function • 1: Problem areas don’t affect function • Reduce scrap cost from $95,000 to $10,000 per year • Asks $40000 to reduce development time to a range of 28 weeks to 32 weeks
Create Hybrid AlternativeThrough Value Analysis & Risk Management • Generate a new alternative that is a hybrid of the Selective Spray and the supplier’s new offer • Improve coating control, reduce scrap cost and development time • Pays $100000 (=$40,000+$60,000) that increases facilities and tooling cost to $400,000 Chapter 6
Enhanced Alternative: Higher Value and Less Risk • Selective Spray+Value&Risk Mng. is the most preferred alternative Chapter 6
More Examples from text • Warehouse location selection • Coating – Value management figures • Disposition of weapons grade plutonium
Figure 6.16: Objectives hierarchy for warehouse selection example
Figure 6.17: Non-linear utility functions for parking spaces
Alternative Utility FedCo Properties 0.600 Center Drive 0.579 Prospect Park 0.421 Northbrook Business Center 0.377 Max. Operational Design Min. Total Cost Max. Space Min. Loss of Current Employees Min. Distance to Key Facilities Max. Building Appearance Figure 6.18: Stacked bar ranking for warehouse site selection example
Overall Utility for FedCo Properties 0.600 Center Drive 0.579 Difference 0.020 Center Drive FedCo Properties Total Difference Number of Truck Docks Lease and Maintenance Cost Office and Lab Space Warehouse Floor Space Appearance Material Handling Cost Number of Parking Spaces Distance to Niles Facility Figure 6.19: Comparison of Center Drive and FedCo Properties facilities
Figure 6.20: Stacked bar ranking after value management for warehouse site selection
Overall Utility for Selective Spray 0.702 Sil-Gel Potting 0.650 Difference 0.051 Sil-Gel Potting Selective Spray Total Difference Material Cost Coating Control Facilities&Tooling Cost Flexibility Foreign Material Weight Development Time Labor Cost Scrap Cost Figure 6.22: Comparison of selective spray and sil-gel potting
Figure 6.25: Ranking alternatives after value and risk management