Download
1 / 55
550 likes | 689 Views
STATISTICS!!!. The science of data. What is data?. Information, in the form of facts or figures obtained from experiments or surveys, used as a basis for making calculations or drawing conclusions. Statistics in Science. Data can be collected about a population (surveys)

E N D
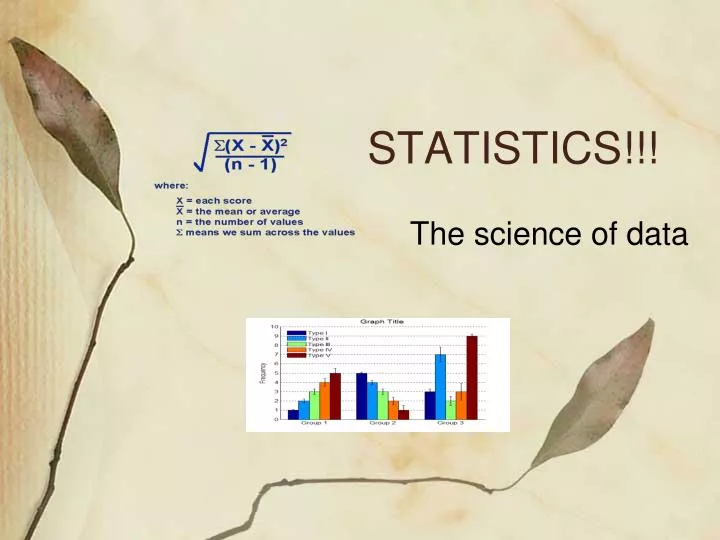
STATISTICS!!! The science of data
What is data? Information, in the form of facts or figures obtained from experiments or surveys, used as a basis for making calculations or drawing conclusions
Statistics in Science • Data can be collected about a population (surveys) • Data can be collected about a process (experimentation)
Biologists often use mathematics • Biology uses mathematics as a tool to examine the natural world. • Many phenomena in the natural world can be measured or counted. Indeed, science is often best at explaining things that can be measured or counted. • The results of many investigations in biology are in the form of numbers. These numbers can often be better understood using mathematics
Example: • In an investigation of the heights of the blades of grass in a field, you measure blades of grass with a ruler. • The result are a set of values=sample • These values must be handled appropriately to give us useful information. • The values have units (e.g. the height of a particular blade of grass is 25 mm). • The values have precision. (E.g. measuring with a ruler might only be precise to ±1 mm, so the height of a particular blade might be 25 ±1 mm. In this case, it could have been 24 mm, or 26 mm, or any value in between these, but not more or less than these). Uncertainty of the instrument.
In collecting data, we should: • include the units • have an appropriate number of decimal places • have a consistent number of decimal places • indicate the precision.
Biologists need statistics • In many investigations of living things, very many numbers are gathered, or could be gathered. • There might be too many numbers for us to easily make sense of the data. We could say that we have a lot of data, but that we do not yet have meaningful information. • Statistics is a branch of mathematics that helps us to handle the large amounts of data that we often obtain in investigations. It helps us to obtain useful information from it and to draw conclusions.
Example. • You are comparing the heights of the blades of grass in two fields. One of these fields has a high concentration of potassium ions in the soil and the other has a low concentration of potassium ions in the soil. • The hypothesis is that the grass is taller in the field with the high soil potassium level than it is in the field with the low soil potassium level. • We would use statistics in planning the investigation, and in helping us to decide whether the results support the hypothesis, or not.
Biologist usually take a sample • Sometimes, it is possible to measure all of the things that are being considered. For example, the heights of all the oak trees in a very small forest. • In statistics, all the values that could be considered is called the population. (Not to be confused with the ecological use of this term). So the heights of all the oak trees in the forest would be the population. • In most investigations, it is not possible, not practical, or not advisable to measure all the values in a population. In these situations, we measure just some of the values. We call such a group of values a sample. • We hope that the values in the sample are representative of the population (that is, that they give an accurate picture of the true population).
Example. • It would not be practical to measure the heights of all the blades of grass in our two fields (the populations of the two fields). • It would take an enormous amount of time • we may not have this much time • our time could be better spent on other tasks. • the heights of the blades might actually change during the time • We might also damage each blade as we measure it • this act of measuring changes the values that we are examining • we may be causing environmental damage in a fragile ecosystem • In such a situation, it is better to take a sample of measurements from each of the two fields.
Lab Experiments • Even in laboratory experiments, we deliberately limit sample sizes. For example, if you are examining the effect of light intensity on the rate of photosynthesis in young bean plants, you could potentially test millions of different bean plants under a range of light intensities, and then repeat the experiment thousands of times. However, in practice you might choose to examine just 50 plants under each light intensity, and to repeat the experiment three times.
Populations and samples show variation • In a population, we usually find that not all the values are identical. Instead, there are differences between the values even inside a population. We call this variation. • The data we obtain from a study has variability.
Example. • The heights of each of the blades of grass in the two fields differ between each other, even inside the same field. • We could measure the height of one blade of grass from each of the two fields (a very small sample) and find that the blade of grass from the field with high potassium is longer than the blade of grass from the field with low potassium. • However, we would still be unsure of whether the difference between the heights of these two blades is due to the field it came from, or was just a difference that occurs anyway within each field.
We could measure the heights of 500 blades of grass in each of the two fields (a larger sample). • We would obtain a set of 500 values for each field. It is difficult for the human mind to obtain useful information from such a large amount of unprocessed data. • However, by using statistics, we can describe the values in various ways that make the information more meaningful for us. Most often, we process the data to estimate an average and to describe the variation in some way.
2 types of Data Qualitative Quantitative
Qualitative Data • Information that relates to characteristics ordescription (observable qualities) • Information is often grouped by descriptive category • Examples • Species of plant • Type of insect • Shades of color • Rank of flavor in taste testing Remember: qualitative data can be “scored” and evaluated numerically
Qualitative data, manipulated numerically • Survey results, teens and need for environmental action
Quantitative data • Quantitative – measured using a naturally occurring numerical scale • Examples • Chemical concentration • Temperature • Length • Weight…etc.
Quantitation • Measurements are often displayed graphically
Quantitation = Measurement • In data collection for Biology, data must be measured carefully, using laboratory equipment (ex. Timers, meter sticks, pH meters, balances , pipettes, etc) • The limits of the equipment used add some uncertainty to the data collected. All equipment has a certain magnitude of uncertainty. For example, is a ruler that is mass-produced a good measure of 1 cm? 1mm? 0.1mm? • For quantitative testing, you must indicate the level of uncertainty of the tool that you are using for measurement!!
How to determine uncertainty? • Usually the instrument manufacturer will indicate this – read what is provided by the manufacturer. • Be sure that the number of significant digits in the data table/graph reflects the precision of the instrument used (for ex. If the manufacturer states that the accuracy of a balance is to 0.1g – and your average mass is 2.06g, be sure to round the average to 2.1g) Your data must be consistent with your measurement tool regarding significant figures.
Finding the limits • As a “rule-of-thumb”, if not specified, use +/- 1/2 of the smallest measurement unit (ex metric ruler is lined to 1mm,so the limit of uncertainty of the ruler is +/- 0.5 mm.) • If the room temperature is read as 25 degrees C, with a thermometer that is scored at 1 degree intervals – what is the range of possible temperatures for the room? • (ans.s +/- 0.5 degrees Celsius - if you read 15oC, it may in fact be 14.5 or 15.5 degrees)
Looking at Data • How accurate is the data? (How close are the data to the “real” results?) • How precise is the data? (All test systems have some uncertainty, due to limits of measurement) Estimation of the limits of the experimental uncertainty is essential.
Comparing Averages • Once the 2 averages are calculated for each set of data (samples), the average values can be plotted together on a graph, to visualize the relationship between the 2
Drawing error bars • The simplest way to draw an error bar is to use the mean as the central point, and to use the distance of the measurement that is furthest from the average as the endpoints of the data bar
Value farthest from average Calculated distance Average value
What do error bars suggest? • If the bars show extensive overlap, it is likely that there is not a significant difference between those values
Quick Review – 3 measures of “Central Tendency” • mode: value that appears most frequently • median: When all data are listed from least to greatest, the value at which half of the observations are greater, and half are lesser. • The most commonly used measure of central tendency is the mean, or arithmetic average (sum of data points divided by the number of points)
Simply measure the lengths of each and plot how many are of each length
This Shape? • Is a classic bell-shaped curve, Gaussian Distribution Curve, Normal Distribution curve. • Essentially it means that in all studies with an adequate number of datapoints (>30) a significant number of results tend to be near the mean. Fewer results are found farther from the mean
Standard deviation • The STANDARD DEVIATION is a more sophisticated indicator of the precision of a set of a given number of measurements • The standard deviation is like an average deviation of measurement values from the mean. In large studies, the standard deviation is used to draw error bars.
According to this curve: • One standard deviation away from the mean in either direction on the horizontal axis (the red area on the preceding graph) accounts for somewhere around 68 percent of the data in this group. • Two standard deviations away from the mean (the red and green areas) account for roughly 95 percent of the data. • Three standard deviationsaway from the mean (the red, green, and blue areas) account for99.7% of all observations
Three Standard Deviations? 68 % 95 % 99.7 % -3sd-2sd+/-1sd2sd+3sd
How is Standard Deviation calculated? With this formula!
AGHHH! • DO I NEED TO KNOW THIS FOR THE TEST?????
Not the formula! • This can be calculated on a scientific calculator • OR…. In Microsoft Excel
You DO need to know the concept! • standard deviation is a statistic that tells how tightly all the individual observations are clustered around the mean in a set of data. • When the individual obs. are tightly bunched together and the bell-shaped curve is narrow, the standard deviation is small.(precise results, smaller sd. Less variation in the sample) • When the individual obs. are spread apart and the bell curve is relatively flat, the standard deviation is large. ( less precise results. More variability of the sample)
In Other Words: Repetition is ESSENTIAL for accurate results
Using the standard deviation to indicate possible significance • A large difference between the means of samples, and small standard deviations for these samples, indicates that it is likely that the difference between the means is statistically significant. • A small difference between the means of samples, and large standard deviations for these samples, indicates that it is likely that the difference between these means is not statistically significant.
Confidence levels • It is seldom possible to say with absolute certainty that the difference between sample means is significant with complete certainty (100 % confidence). • Instead, we determine if the difference between the sample means is probably significant. • Most often in biology, we decide that we want to be 95 % confident that the difference between the samples is significant.
This means that there is only a 5 % chance that the samples could be as different as they are because of chance, and not because of a real difference between the populations. • We could also say that we are confident that the probability (p) that chance alone produced the difference between our sample means is 5 % (p = 0.05). • We determine whether the samples are significantly different at the 95 % confidence level.
The t-test • The t-test determines whether the difference observed between the means of two samples is significantly, at a chosen confidence level. • The test assumes that the data(of each sample) is normally distributed (remember that there are special rules that describe the variation in the data). The sample size must be at least 10. • The test works by considering the following: • The size of the difference between the means of the samples. • The number of observations in each sample=n • The amount of variation between the individual values inside of each sample (the standard deviation).