Download

1 / 10
130 likes | 666 Views
§9.1 Quadratic Graphs and Their Properties. Warm-Up. Evaluate each expression for h = 3, k = 2, and j = –4. 1. hkj 2. kh 2 3. hk 2 4. kj 2 + h. Graph each equation. 5. y = 2 x – 1 6 . y = | x | 7 . y = x 2 + 2.

E N D
Warm-Up Evaluate each expression for h = 3,k = 2, and j = –4. 1. hkj2. kh23. hk24. kj2+ h Graph each equation. 5.y= 2x – 1 6.y = | x | 7.y = x2 + 2
1.hkj for h= 3, k = 2, j = –4: (3)(2)(–4) = 6(–4) = –24 2.kh2 for h= 3, k = 2: 2(32) = 2(9) = 18 3.hk2 for h= 3, k = 2: 3(22) = 3(4) = 12 4.kj 2 + h for h= 3, k = 2, j = –4: 2(–4)2 + 3 = 2(16) + 3 = 32 + 3 = 35 5.y= 2x – 1 6.y = | x | 7.y = x2 + 2 Solutions
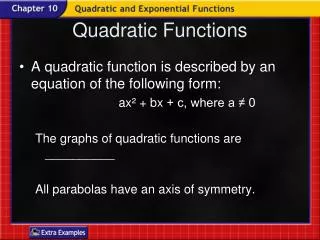
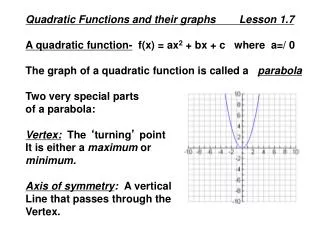
Example 1: Indentifying a Vertex Identify the vertex of each graph. Tell whether it is a minimum or a maximum. a. b. The vertex is (1, 2). The vertex is (2, –4). It is a maximum. It is a minimum.
1 3 xy= x2 (x, y) 1 3 0 (0)2= 0(0, 0) 1 3 1 3 1 3 2 (2)2= 1(2, 1 ) 1 3 3 (3)2= 3(3, 3) Example 2: Graphing y = ax2 1 3 Make a table of values and graph the quadratic function y= x2.
1 2 (x) = x2 (x) = –3x2 (x) = –x2 1 2 Of the three graphs, (x) = x2 is the widest and (x) = –3x2 is the narrowest. 1 2 So, the order from widest to narrowest is (x) = x2, (x) = –x2, (x) = –3x2. Example 3: Comparing Widths of Parabolas Use the graphs below. Order the quadratic functions (x) = –x2, (x) = –3x2,and (x) = x2 from widest to narrowest graph. 1 2
xy= 3x2 y= 3x2 – 2 - 2 12 10 –1 3 1 0 0 2 1 3 1 2 12 10 Example 4: Graphing ax2 + c Graph the quadratic functions y= 3x2 and y= 3x2 – 2. Compare the graphs. The graph of y= 3x2 – 2 has the same shape as the graph of y= 3x2, but it is shifted down 2 units.
th = –16t2 + 26 0 26 1 10 2 –38 Example 5: Using the Falling Object Model A monkey drops an orange from a branch 26 ft above the ground. The force of gravity causes the orange to fall toward Earth. The function h = –16t2 + 26 gives the height of the orange, h, in feet after t seconds. Graph this quadratic function.
Height h is dependent on time t. Graph t on the x-axis and h on the y-axis. Use positive values for t. Example 5: Using the Falling Object Model A monkey drops an orange from a branch 26 ft above the ground. The force of gravity causes the orange to fall toward Earth. The function h = –16t2 + 26 gives the height of the orange, h, in feet after t seconds. Graph this quadratic function.
Assignment: Pg. 550 7-27 Left