Download
1 / 43
430 likes | 571 Views
SIMS 247: Information Visualization and Presentation Marti Hearst. Sep 26, 2005. Today. Multidimensional Visualization and How to Do Exploratory Data Analysis More Spotfire demonstration More Tableau demonstration Table Lens Comparative Evaluation of Three Systems Parallel Coordinates

E N D
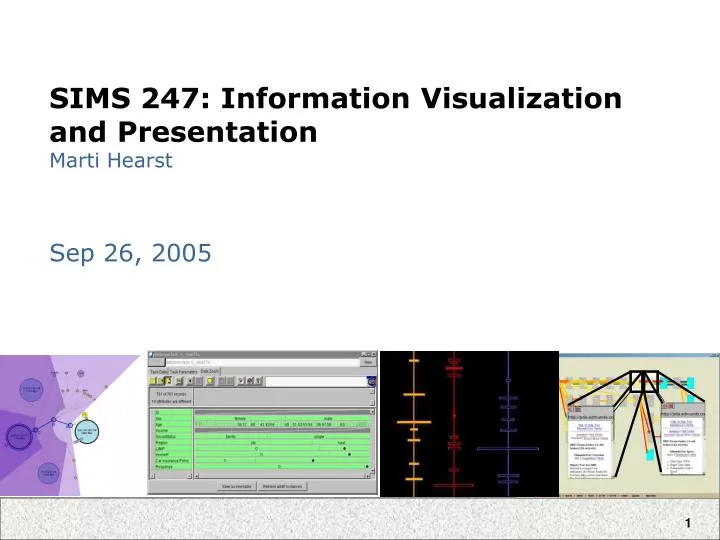
SIMS 247: Information Visualization and PresentationMarti Hearst Sep 26, 2005
Today • Multidimensional Visualization and How to Do Exploratory Data Analysis • More Spotfire demonstration • More Tableau demonstration • Table Lens • Comparative Evaluation of Three Systems • Parallel Coordinates • Intro paper • Example of usage
Table Lens • Super Spreadsheets • Combines overview + details in an integrated view • Focus + Context allows for compressed representation • Sorting multiple columns allows patterns to emerge • Represents nominal data in a way that allows patterns to appear • Demo • http://www.avizsoft.com/contents/table-lens-demo.htm
Table Lens Demo http://www.avizsoft.com/contents/table-lens-demo.htm
Comparing 3 Commercial Systems Alfred Kobsa, An Empirical Comparison of Three Commercial Information Visualization Systems, INFOVIS'01.
Infozoom Demo http://files.messe.de/www.cebit.de/infozoom/index_en.html
Infozoom Presents data in three different views: • Overview mode has all attributes in ascending or descending order and independent of each other. • Best for data exploration • Wide view shows data set in a table format • A column represents a data item • Like a conventional spreadsheet • Compressed view packs the data set horizontally to fit the window width. • A column represents a data item • Zoomed-out view like Table Lens
InfoZoom Overview View Slide by Alfred Kobsa
InfoZoom Overview View(with hierarchy) Slide by Alfred Kobsa
Datasets for Study • Multidimensional data: three databases were used • Anonymized data from a web based dating service (60 records, 27 variables) • Technical data of cars sold in 1970 – 82 (406 records, 10 variables) • Data on the concentration of heavy metals in Sweden (2298 records, 14 variables) Slide by Kunal Garach
Sample Questions • Dating database • Do more women than men want their partners to have a higher education? • What proportion of the men live in California? • Do all people who think the bar is a good place to meet a mate also believe in love at first site? • Car database • Do heavier cars have more horsepower? • Which manufacturer produced the most cars in 1980? • Is there a relationship between the displacement and acceleration of a vehicle?
Experiment Design The experimenters generated 26 tasks from all three data sets. 83 participants. Between-subjects design. Each was given one visualization system and all three data sets. Type of visualization system was the independent variable between them. 30 mins were given to solve the tasks of each data set i.e 26 tasks in 90 mins. Slide by Kunal Garach
Overall Results • Mean task completion times: • Infozoom users: 80 secs • Spotfire users: 107 secs • Eureka users: 110 secs • Answer correctness: • Infozoom users: 68% • Spotfire users: 75% • Eureka users: 71% • Not a time-error tradeoff • Spotfire more accurate on only 6 questions Slide by Kunal Garach
Eureka - problems Hidden labels: Labels are vertically aligned, max 20 dimensions Problems with queries involving 3 or more attributes Correlation problems: Some participants had trouble answering questions correctly that involved correlations between two attributes. Slide by Kunal Garach
Spotfire - problems • Cognitive setup costs: Takes participants considerable time to decide on the right representation and to correctly set the coordinates and parameters. • Biased by scatterplot default: Though powerful, many problems cannot be solved (well) with it. Slide by Kunal Garach
Infozoom - problems • Erroneous Correlations • People forget/don’t realize that overview mode has all attributes sorted independent of each other • Narrow row height in compressed view • Participants did not use row expansion and scatterplot charting function which shows correlations more accurately Slide by Kunal Garach
Geographic Questions • Spotfire should have done better on these • Which part of the country has the most copper • Is there a relationship between the concentration of vanadin and that of zinc? • Is there a low-level chrome area that is high in vanadim? • Spotfire was only better only for the last question (out of 6 geographic ones)
Discussion • Many studies of this kind use relatively simple tasks that mirror the strengths of the system • Find the one object with the maximum value for a property • Count how many of certain attributes there are • This study looked at more complex, realistic, and varied questions.
Discussion • Success of a visualization system depends on many factors: • Properties supplied • Spotfire doesn’t visualize as many dimensions simultaneously • Operations • Zooming easy in InfoZoom; allows for drill-down as well • Zooming in Eureka causes context to be lost • Column view in Eureka makes labels hard to see
Multidimensional Detective A. Inselberg, Multidimensional Detective, Proceedings of IEEE Symposium on Information Visualization (InfoVis '97), 1997. Do Not Let the Picture Scare You!!
Inselberg’s Principles A. Inselberg, Multidimensional Detective, Proceedings of IEEE Symposium on Information Visualization (InfoVis '97), 1997 • Do not let the picture scare you • Understand your objectives • Use them to obtain visual cues • Carefully scrutinize the picture • Test your assumptions, especially the “I am really sure of’s” • You can’t be unlucky all the time!
A Detective Story A. Inselberg, Multidimensional Detective, Proceedings of IEEE Symposium on Information Visualization (InfoVis '97), 1997 • The Dataset: • Production data for 473 batches of a VLSI chip • 16 process parameters: • X1: The yield: % of produced chips that are useful • X2: The quality of the produced chips (speed) • X3 … X12: 10 types of defects (zero defects shown at top) • X13 … X16: 4 physical parameters • The Objective: • Raise the yield (X1) and maintain high quality (X2)
Multidimensional Detective • Each line represents the values for one batch of chips • This figure shows what happens when only those batches with both high X1 and high X2 are chosen • Notice the separation in values at X15 • Also, some batches with few X3 defects are not in this high-yield/high-quality group.
Multidimensional Detective • Now look for batches which have nearly zero defects. • For 9 out of 10 defect categories • Most of these have low yields • This is surprising because we know from the first diagram that some defects are ok.
Go back to first diagram, looking at defect categories. Notice that X6 behaves differently than the rest. Allow two defects, where one defect in X6. This results in the very best batch appearing.
Multidimensional Detective • Fig 5 and 6 show that high yield batches don’t have non-zero values for defects of type X3 and X6 • Don’t believe your assumptions … • Looking now at X15 we see the separation is important • Lower values of this property end up in the better yield batches
Automated Analysis A. Inselberg, Automated Knowledge Discovery using Parallel Coordinates, INFOVIS ‘99
Parallel Coordinates Software • Parvis (free) • http://home.subnet.at/flo/mv/parvis/ • XmdvTool (free) • http://davis.wpi.edu/~xmdv/vis_parcoord.html • Parallax • Al Inselberg’s version • I’m not sure of the status of it.
Integrating Viz into a UI • Vizcraft: VizCraft: A Problem-Solving Environment for Aircraft Configuration Design, Goe, Baker, Shaffer, Grossman, Mason, Watson, Haftka, IEEE Computing, pp. 56-66, 2001 • Solving an Analysis Problem • Optimizing design of aircraft • Uses of Viz: • Brushing and linking • Color • Multiple views • Parallel Coordinates
Use of Color in Vizcraft Incorrect Good Not Sure
Doing Analysis in VizCraft Colored according to value in first attribute Shows that 2nd and N-6th are correlated with 1st
Doing Analysis in VizCraft Colored according to value in fifth attribute Shows that 5th and 7th attributes are correlated
Doing Analysis in VizCraft Select only low values of 1st variable (normalized after the fact) The idea is to learn about the acceptable ranges for the values of the other variables
Doing Analysis in VizCraft Color according to one constraint Confusing – using the constraint colors in two ways simultaneously.
Next Time • Guidelines for Multiple Views • Zoomable Interfaces • Overview + Detail