Download
1 / 54
560 likes | 753 Views
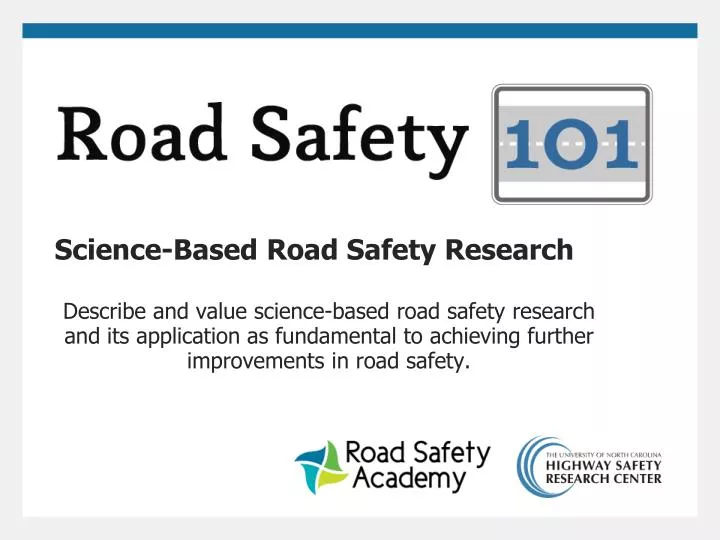
Science-Based Road Safety Research. Science-Based Road Safety Research Describe and value science-based road safety research and its application as fundamental to achieving further improvements in road safety. Major Topics. Traditional Methods Used In Safety Decisions

E N D
Science-Based Road Safety Research Science-Based Road Safety Research Describe and value science-based road safety research and its application as fundamental to achieving further improvements in road safety.
Major Topics • Traditional Methods Used In Safety Decisions • Engineering and Public Health Science-based Methods • Quality Data and Data Systems • Data Driven Approaches to Road Safety • The Importance of Professional Support for Science-based Approaches
Methods of Transportation Decision Making • Expert Opinion • Conventional Wisdom • Collective Experience • Scientific Method
Weaknesses of Traditional Methods • We Are All Safety Experts • Just ask us! • Our Personal Experience Can Skew our View • School bus collisions – Need for safety belts? • Pre-Historic Brain in Modern Society • Great at “fight or flight” • Not so great at long-term risk assessment
We Estimate Risks Poorly! CDC 2009 data -- http://www.cdc.gov/nchs/data/nvsr/nvsr59/nvsr59_04.pdf
Weaknesses of Other Methods • Crashes Vary Randomly • Across time, space, driver group, etc. • And our observations don’t see through the randomness • Our Hunches are Often Incorrect • Often based on personal experience and emotions • We Have An Inability to Internally Process Data • …Which Results In Counter-productive Recommendations • Thus the Need for Careful Measurement and Analysis
Why Science? The purpose of Science is to learn and test new knowledge… In short, the justification for basic research in all fields lies in the knowledge-generating utility of scientific discoveries and in the well-founded anticipation—but not guarantee—that some of those discoveries will in the long run prove to be of great practical benefit.
Five Characteristics of Science • Can Withstand Public Scrutiny • Willing to Do without Answers -- (i.e., “We don’t know yet”) • Doubt Is Unpleasant; Certainty Is Absurd • Willing to Question the Obvious • Ability to Test among Competing Answers
Steps in the Scientific Process • Review the Literature. • Postulate Relationships or Theories. • Generate Testable Research Hypotheses. • Design a Study. • Collect Data. • Apply Appropriate Statistical Methods and/or Models. • Correctly Interpret Results.
Question: Rationale for Safety Research Why do we conduct safety research?
Safety Research Goal The goal of safety research is to illuminate ways to reduce the negative consequences associated with motor vehicle related transportation such as fatalities, injuries, property damage, and congestion. (So, there is often a “tradeoff” between safety and mobility.)
Safety Research Goal (cont) • Whether Fundamental or Applied Research, the Ultimate Goal Is To Reduce Crash Harm. • Need To Be Able To Associate “Cause” With “Effect” • Defining new treatments based on better information on crash or injury causes • Evaluations -- measuring true effect of treatment (i.e., insuring that the treatment is the cause of the observed change) • Linking cause and effect is difficult to do • Nature is messy – other things “confound” the linkage
Observational Study Limitation • Experiments link cause and effect better! • But, Lack of Safety Experiments • Almost never can we randomly assign treatments (e.g., licensing age, median widths) • Why? • Weaknesses in Observational Studies • Occupant restraint use (i.e., difficulty in night-time observations) • Can’t observe “non-crashes” (i.e., vehicle designs; speeding) • Lack of adequate exposure data (e.g., distracted driver exposure)
Data Quality and Limitations The government is very keen on amassing statistics – they collect them, add them, raise them to the nth power take the cube root and prepare wonderful diagrams. But what you must never forget is that every one of those figures in the first instance comes from the village watchman, who just puts down what he damn well pleases. Sir Josiah Stamp (1929) Traffic Safety and Human Behavior, David Shinar
Technologies Being Applied in Safety Research • Reporting Crashes (e.g., cell phone, GPS, electronic crash forms) • Responding to Crashes (e.g., ambulance dispatch systems) • Collecting Victim and Crash Information (e.g., in-ambulance monitoring) • Managing and Storing Crash Information • Linking Crash Records with Hospital Records (e.g., CODES – Crash Outcome Data Evaluation System) • Analyzing Crashes (e.g., empirical Bayes, cohort designs) • Disseminating Crash Information to Stakeholder Agencies • Educating Safety Professionals (e.g., web-based training)
Data Driven Success • We’ve reached the target, but we need to know why. What has worked?
Question Examples of where scientific study has led to crash injury reductions? (Driver, vehicle, roadway treatments?)
Science-Based Treatments • Driver Treatments • Graduated Driver Licensing, occupant restraint laws, alcohol-related enforcement/education programs • Vehicle Treatments • Airbags, anti-lock brakes, electronic stability control, improved crash “cage” • Roadway Treatments • Cable median barriers, improved guardrail ends, rumble strips, improved crash barriers
Prerequisites for Support of Science-Based Safety How Can All Safety Organizations Make Science-Based Safety a Priority? • Assess Safety as Part of Organization Mission/Charge • Find and Fund Champions • Resources – staff, computers, training budget, etc. • Search for “Truth” • Even if it disagrees with conventional knowledge and organizational practices
Review • Traditional Methods Used In Safety Decisions • Engineering and Public Health Science-based Methods • Quality Data and Data Systems • Data Driven Approaches to Road Safety • The Importance of Professional Support for Science-based Approaches
Major Topics • Introduction to the Highway Safety Manual • Nominal Safety versus Substantive Safety • Regression-to-the-Mean • Quantifying Safety Performance: safety performance functions • Safety Management Process
Poll • Did you hear about the Highway Safety Manual before taking this class? • Yes • No
Highway Safety Manual (HSM) • Published in 2010 by AASHTO • HSM does not establish a legal standard • The purpose for the HSM is to provide the information and tools in a useful form to facilitate roadway planning, design, operations, and maintenance decisions based on explicit consideration of their safety consequences
Part A of the HSM • Chapter 1: Introduction and Overview • Brief overview of the HSM • Relationship among different parts of the HSM • Chapter 2: Human Factors • Introduction to core elements of human factors • How drivers interact with the roadway • Chapter 3: Fundamentals • Statistical concepts • Data issues
Part B: Roadway Safety Management Process Prioritization of Improvement Projects Network Screening Countermeasure Selection Network Screening 6 7 9 5 8 4 Diagnosis Economic Appraisal Safety Effectiveness Evaluation
Part C of the HSM • Two-lane Rural Roads • Rural Multilane Highways • Urban and Suburban Arterials • Method • Applications • Safety issues not explicitly addressed • Example problems • References
Part D of the HSM (Crash Modification Factors) • Chapter 13: Roadway Segments • Chapter 14: Intersections • Chapter 15: Interchanges • Chapter 16: Special Facilities and Geometric Situations • Chapter 17: Road Networks
Assess the system needs & identify projects/studies • Program projects • Evaluate system-wide safety effects of programs
Define problem(s) and assist in scoping • Identify potential solutions • Assess or evaluate multiple alternatives and expected quantitative safety effects • Aid in identification of a preferred alternative
Evaluate safety of alternative design approaches • Assist in review & documentation of design exceptions, variances and waivers • Inform decisions on construction staging, work approaches, etc.
Monitor operations to maintain balance among safety, mobility and access. • Evaluate the effectiveness of implemented improvements
Concepts in Safety Analysis • Nominal versus Substantive Safety • Regression to the Mean • Quantifying Safety Performance • Empirical Bayes Method
Nominal vs Substantive Safety • Nominal • Does a design element meet the minimum criteria based on a standard • AASHTO Green Book – roadway design • MUTCD – traffic control devices • Consider safe if it meets the standard • Does not characterize actual or expected crashes • Substantive • Refers to actual or expected safety • Severity • Type • Rate • Compare safety performance of a facility with the expected performance for similar facilities • Evidence based – followed in the HSM
Unlike Nominal Safety, Substantive Safety is a Continuum SubstantiveSafety Nominal Safety CRASHRISK CRASH RISK DESIGNDIMENSION LaneWidth, RadiusofCurve, StoppingSightDistance, etc. DESIGN DIMENSION Lane Width, Radius of Curve, Stopping Sight Distance, etc.
Regression to the Mean • This is a poll - Have you heard of the term regression to the mean? • Yes • No • If yes, can you explain what it means – type in the chat pod
Regression to the Mean • Crashes are random events that naturally fluctuate over time. • Regression to the mean (RTM) refers to the phenomenon of ‘averaging out’ in statistics • May lead us to confuse random change with real change • Crashes are artificially high during the before period and would have been reduced even without any improvement to the site
Table 1.1 1974-1975 San Francisco Data Source: Hauer, E., 1986
Table 1.2 1975-1976 San Francisco Data Source: Hauer, E., 1986 Source: Hauer, E., 1986
Quantifying Safety Performance • Exposure – the amount of travel that underlies any observed number of crashes • Crash rate • Crashes/VMT • Fatalities/number of licensed drivers • Injuries/capita • Using crash rates implicitly assume that crash frequency and exposure are linearly related • Exposure should be related to crashes by a function
Linear relationship between exposure and crash frequency Crashes per Unit Time Traffic Volume
Non-linear relationship between exposure and crash frequency (example 1) Crashes per Unit Time Traffic Volume
Non-linear relationship between exposure and crash frequency (example 2) Crashes per Unit Time Traffic Volume
Non-linear relationship between exposure and crash frequency (example 3) Crashes per Unit Time Traffic Volume
Safety Performance Functions • Graphs shown earlier are examples of Safety Performance Functions (SPFs) • Represent the change in the mean expected number of crashes at similar entities as traffic volume (or other exposure measure) increases • Mathematical equations estimated using a curve fitting procedure (negative binomial regression) • Shape of the SPF may depend on facility type, crash type, etc.
Examples of SPFs • Project for North Carolina Department of Transportation • 4 lane rural freeways within the influence of interchanges • Predict crashes per mile per year (Y) • Multi-vehicle crashes • Y =(e-16.3152)(AADT1.706) • Single-vehicle crashes: • Y =(e-3.1228)(AADT0.4584)