Download
1 / 22
220 likes | 333 Views
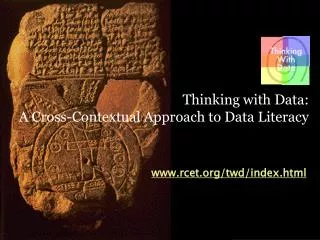
Thinking With Data Revisited: An Investigation into Why the Approach Works Mark van ‘t Hooft, Annette Kratcoski, Dale Cook Kent State University RCET Karen Swan University of Illinois, Springfield Phil Vahey, Ken Rafanan, Tina Stanford, Louise Yarnall SRI International.

E N D
Thinking With Data Revisited: An Investigation into Why the Approach Works Mark van ‘t Hooft, Annette Kratcoski, Dale Cook Kent State University RCET Karen Swan University of Illinois, Springfield Phil Vahey, Ken Rafanan, Tina Stanford, Louise Yarnall SRI International www.rcet.org/twd/index.html
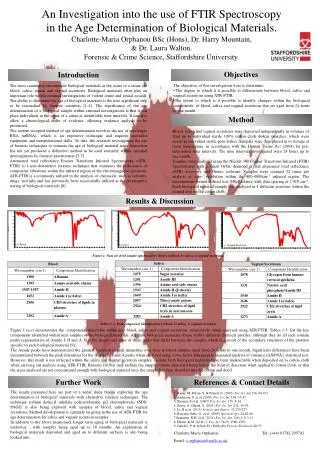
Thinking with Data (TWD) Primary Goal • Develop middle school students’ deep understanding of data literacy across the curriculum. “We use data every day—to choose medications or health practices, to decide on a place to live, or to make judgments about education policy and practice. The newspapers and TV news are full of data about nutrition, side effects of popular drugs, and polls for current elections. Surely there is valuable information here, but how do you judge the reliability of what you read, see, or hear? This is no trivial skill—and we are not preparing students to make these critical and subtle distinctions.” -- Andee Rubin The research reported on in this paper was funded by the National Science Foundation under Grant NO. NSF ESI-0628122. Any opinions, findings, and conclusions or recommendations expressed in this paper are those of the authors and do not necessarily reflect the views of the National Science Foundation.
TWD Unit Context • Water situation in the Tigris/Euphrates & 8 US watersheds • U.N. convention states that international water courses should be used in “an equitable and reasonable manner”
TWD Modules & Materials • Four 2-week, integrated replacement modules for implementation in 7th grade. • Core domain content (using real-world data) • SS: water sharing among Turkey, Syria, & Iraq • Math: proportional reasoning • Science: impact of technology on water availability/quality • ELA: persuasive arguments • Modules implemented sequentially; no other requirements. • Assessments included: • An overall data literacy assessment (TWD and comparison groups) • Math and Science assessments (TWD only) • ELA final projects (TWD only)
TWD and Data Literacy • The modules address issues of data representation, proportional reasoning, and argumentation using real data in discipline-specific problem-solving contexts. Data literacy skills used include: • Formulating and answering data-based questions • Using appropriate data, tools, and representations • Solving real problems and communicate their solutions • Anchor learning in the idea of fairness of: • Comparisons, e.g. water distribution • Measures, e.g. per capita distribution • Arguments, e.g. accurate, relevant, complete
Preparation for Future Learning (PFL) • Students are more likely to learn when they have recognized the existence of a problem before being presented with a solution. • In this framework students first prepare by investigating a set of problems that are designed to highlight the structure of an important concept. Instead of creating complete solutions, students come to understand the structure of the concept, and internalize key dimensions of the situation. • Students then engage in a formal learning activity in which they are introduced to a standard solution, and which they then practice and apply in a variety of contexts.
Procedures • Pilot Test (2007-2008) with 42 7th grade students and 2 teachers • Module revisions made and materials posted online • Field Test (2008-2009): 2 middle schools; experimental (n=114) and control (n= 462) • 2009-2010: Final module revisions made
Data Sources • Lesson Plans • PD Materials and Notes • Data Literacy Pre/Post Assessment • Math and Science Subject Assessments • Classroom Observations • Student Artifacts • Student Reflections about the Unit • Teacher Interviews (by External Evaluator)
Initial Research Findings (2008) • Teachers are able to effectively implement the cross-disciplinary TWD curriculum modules with appropriate administrative support and PD; • Students who engage in the TWD curriculum increase their understanding of cross-disciplinary data literacy; • Students who engage in the modules also increase their understanding of disciplinary content in Mathematics and Science (evidence not as strong here); • TWD is scalable as long as teachers receive ample PD and work together as a team.
Findings (PFL and PFL+) • Question: • How do individual teachers move/not move the overall PFL+ agenda forward? • Analysis: • Observation data and teacher interviews • Findings: • SS: problematizing the issue. Limited opportunities for inventing solutions were not implemented or cut short. • Math: formal learning, with the first lesson as a bridge between ss and math (preparation), while some of the other lessons mixed learning with application. • Science: data-based explanations; the first three lessons prepared students for the last one. All four lessons also centered on application of prior learning. • ELA: transfer of data literacy skills replaced by focus on elements of a written essay, falling short of using data to back up a written argument. Communication of arguments as traditional presentations, without scaffolded discussion. • Overall, teachers followed the curriculum fairly closely, (ELA = possible exception), but did not make as many connections between modules as expected. This could be a shortcoming of the materials and has been addressed by the addition of more explicit cross-disciplinary connections.
Findings (PFL and PFL+) Question: Is there an impact of the PFL+ cycle on student learning of data literacy? Analysis: Three data points by matching up items from data-lit pre/post with the math post test and transforming scores to common scale, in order to perform a repeated measures analysis (data sample from School 1, n=80). Data Lit Post-Test Data Lit Pre-Test Math Post-Test
Findings (PFL and PFL+) Question: Is there an impact of the PFL+ cycle on student learning of data literacy? Findings: Overall Pillai’s Trace = .709 (F = 95.203, p < .000, partial η2 = .709). Post-hoc pairwise comparisons showed statistically significant gains from pre-DL to post-math assessments and pre-DL to post-DL, but a statistically significant decrease from post-Math to post-DL.
Findings (PFL and PFL+) • Question: • Is there an impact of the PFL+ cycle on student learning of data literacy? • Findings: • By item: similar findings, except for the pair DL 4, Math 7a. Promising because: • the content (proportional reasoning) was the focus of the TWD unit; • out of all of the items paired DL 4 and Math 7a were the closest match in content and difficulty level.
Findings (PFL and PFL+) Question: When engaging in activities within one discipline, do teachers use the full PFL+ framework as designed in the unit materials, and is there an impact of the PFL cycle on student learning of subject-specific content (including subject-specific data literacy)? Analysis: analyzed teacher and student materials to create a map across all lessons in each module of each instance of an intended complete PFL routine (inventing, sharing, and telling). We then re-analyzed observations to rate the completeness of implementation by noting each instance of inventing, sharing, and formal instruction within that routine Findings: Overall, the use and success of PFL cycles within modules differed, depending on the teacher.
Findings (PFL and PFL+) Question: When engaging in activities within one discipline, do teachers use the full PFL+ framework as designed in the unit materials, and is there an impact of the PFL cycle on student learning of subject-specific content (including subject-specific data literacy)? Analysis: Math and Science post-tests and student reflections. • Findings: • Test data show increases in math. • Not enough evidence to say the same about science. • Student reflections suggest that they were aware of the PFL cycle and thought it made a difference.
Findings (Cross-Disciplinary Links) Question: How are teachers able to leverage the cross-disciplinary links across modules, and are these consistent with how the materials were designed? Analysis: Observation notes were analyzed, comparing teacher actions with expectations as expressed in the TWD materials (lesson plans, notes provided during professional development, and student materials). Instances were noted in which (a) cross-disciplinary links were noted in the materials and made by teachers; (b) links were noted in the materials but not made by teachers; (c) links were not noted in the materials and made by teachers; and (d) links were neither noted in the materials nor made by teachers, but could/ should have been. Findings: For the most part, teachers linked to other modules when prompted to do so by the materials, especially in mathematics and science. However, not many links were made.
Findings (Cross-Disciplinary Links) Question: In what ways does students’ written work build upon the cross-disciplinary links across modules, and does an increase in links lead to an increase in their understanding of cross-disciplinary data literacy? Analysis: Analysis of a representative sample of student work (stratified random sample for gender and data literacy gain scores (high, medium, low); n=24. Findings: Students did not make cross-disciplinary links unless explicitly prompted to do so by the materials. This may also be a reflection of the relatively low number of links made by teachers.
Conclusions While teachers tended to move the overall PFL+ agenda forward within their own modules (question 1a), they did not make as many cross-disciplinary links as they could/should have (question 2a). There is no evidence of students making those same connections in their work (question 2b), but post-unit interviews indicated that they did make them (possibly more implicitly), and earlier research shows that the approach has a positive impact on learning.
Conclusions With regards to data literacy skills (question 1b), data analysis tended to indicate that most learning occurred during the social studies and mathematics modules, while gains and/or decreases during the science and ELA modules need to be more closely examined. Use and success of PFL cycles within modules varied by teacher (question 1c). Even so, previous research showed that the TWD curriculum had a positive impact on student learning in mathematics. Effects on learning in science need to be investigated more closely, as we were not able to collect the necessary evidence during the research reported on in this paper.
Future Work • Adjustment of the TWD and related professional development materials to stress the importance of the PFL cycles within individual modules and the interdisciplinary connections between them. • More work is needed in the areas of making students’ cross-disciplinary linking explicitly visible. This will then enable us to document such links and evaluate their impact on learning data literacy knowledge and skills, as well as subject-specific content.
www.rcet.org/twd/index.html mvanthoo@kent.edu kswan4@uis.edu philip.vahey@sri.com