Download
1 / 29
300 likes | 467 Views
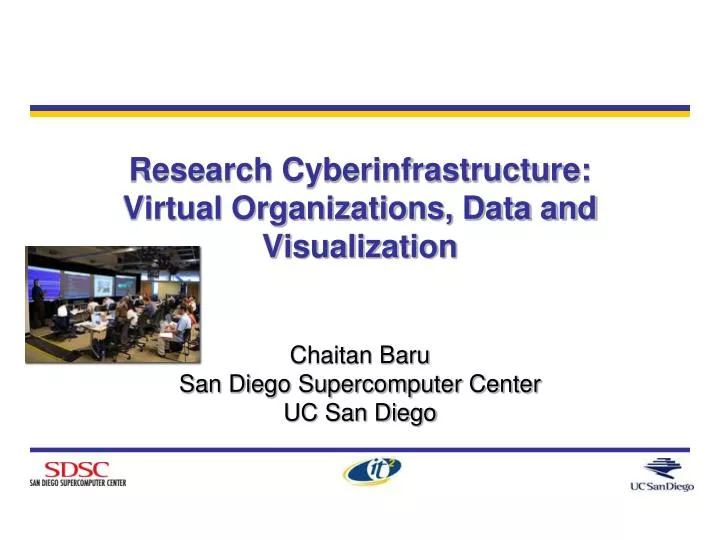
Research Cyberinfrastructure: Virtual Organizations, Data and Visualization. Chaitan Baru San Diego Supercomputer Center UC San Diego. Outline. Virtual Organizations and Data Sharing Portals Visualization and Cyberdashboards Collaboration, and the Socio-technical Infrastructure.

E N D
Research Cyberinfrastructure: Virtual Organizations, Data and Visualization Chaitan Baru San Diego Supercomputer Center UC San Diego
Outline • Virtual Organizations and Data Sharing • Portals • Visualization and Cyberdashboards • Collaboration, and the Socio-technical Infrastructure
Some VO Projects • BIRN, www.nbirn.net (NIH) • Biomedical Informatics Research Network • VO for sharing neuroscience imaging data • NEES, www.nees.org, it.nees.org (NSF) • Network for Earthquake Engineering Simulations • VO for sharing earthquake engineering experiment and simulation data • GEON, www.geongrid.org (NSF) • Geosciences Network • VO to facilitate integration of earth sciences data • TEAM, www.teamnetwork.org, (Moore/Conservation International) • Tropical Ecology, Assessment and Monitoring • VO for sharing field ecology data from wildland sites in the tropics
More VO Projects… • GLEON, www.gleon.org (Moore, NSF) • Global Lake Ecology Observation Network • VO for sharing lake ecological data • TDAR, www.tdar.org (NSF) • The Digital Archaeological Record • Sharing of data from different digs • MOCA, moca.anthropogeny.org (Mathers, UCSD) • Museum of Comparative Anthropogeny • Creation of a phenomic information resource for investigating the origin of humans • Many others…in high energy physics, astronomy, climate/atmospheric research, hydrology, ecology, biomedicine, emergency response, …
Cyberinfrastructure at the speed of research • In some cases, “do what it takes” to keep up • Take shortcuts • Leverage infrastructure from other CI projects and off-the-shelf products • Difficult because • Can be stressful on software developers who take pride in creating their own • Software engineers may think PI is changing course too many times • In other cases, “don’t get too far ahead” of the users • User community may see no apparent benefit to the infrastructure being developed • And, therefore, become frustrated and may stop using the system entirely
“Community data” and the nature of data sharing • Physics: • Petabytes of data from the same detector, shared by a global research community. Common physics model. • Astronomy: • Petabytes of digital data from the same telescopes, shared by a global research community. Common astrophysics model. • Biomedicine: • 100’s terabyte to several petabytes of digital imaging data about the same human organ (e.g. brain) from different individuals. Common organ model. • Earth Science (e.g. geophysics): • 10’s-100’s Terabytes of seismic sensor data and tomographic image data, shared by a global research and hazards response and policy community. Common Earth model.
“Community data” and the nature of data sharing • Ecology: • 10’s of terabytes of sensor and field ecology data. There may be common models at local and regional scale. What is the common model at continental and global scale? • Archaeology • Megabytes to terabytes of data from archaeological digs. What is the common model?The data may be the model. • Social Sciences • Sharing data from surveys of small populations • Share data or share models? What is the metadata for models? Is there a way to “normalize” the data, e.g. basic steps such as creating grids from non-gridded data
Portal-based Science EnvironmentsSupport for resource sharing and collaborations
GEON Portal and Cyberinfrastructure provide: Authenticated access to data and Web services Registration of data sets, tools, and services with metadata Search for data, tools, and services, using ontologies Scientific workflow environment and access to HPC Data and map integration capability Scientific data visualization and GIS mapping GEON Portal
EarthScope Data Portal • SDSC • San Diego • IRIS • Seattle • UNAVCO • Boulder • ICDP • Potsdam
Cyberdashboard for Emergency Response • 2007 San Diego Wildfires • 911 calls • Data mining of spatiotemporal data • Analysis of calls during San Diego wildfires, Oct 2007 • Wildfire Evacuations • Visualization of data from Red Cross disastersafe database • California Fire Plan • UCSD/SDSC will assist in the new Fire Plan for State of California • Campus-scale information
Cyberinfrastructure for Data Visualization • On-demand access to data • Short lead times from request to readiness to rendering and display • On-demand access to computing • Online modeling, analysis, and visualization tools • “On-line” Collaboration environments • Software architecture • Facility architecture
Derived 3D volumetric model • Multiple isosurfaces, with different transparencies • Slices through the volume • Variable gridding: data typically has lower resolution at greater depths • 2D surface data: Satellite imagery, street maps, geologic maps, terrain surface, fault lines, and other derived features etc. • Bore hole or well data Software: E.g. OpenEarth Framework Interactive Visualization of 3D/4D earth science data • “For a given region (i.e. lat/long extent, plus depth), return a 3D structural model with accompanying physical parameters of density, seismic velocities, geochemistry, and geologic ages, using a cell size of 10km”
Facility: E.g. SDSC / Calit2 Synthesis Center • Conceived as a collaboration space “to do” science • Bring together … • High-performance computing • Large-scale data storage • In-person collaboration • Technical professionals to move projects forward • Face-to-face collaborations • Are important, even in a “flat world” where distance is disappearing…
Synthesis Center Facility • Large meeting space • Multiple display devices • Private conference room with high resolution projection system
A variety of uses • Viz-oriented workshops • GEON Visualization workshop • Workshop on Visualization of Large Biomolecular Complexes • Tsunami Recon Data Workshop • GEON Workshop on Constructing, Editing, and Visualizing Integrated models of Earth Structure • GEON Digital Acquisition Workshop: From hand-held computers to ground-based LIDAR • Classes / Hands-on • UCSD Digital Photo Class • GEON Summer Institute • NBCR Summer Institute • GEON Portal Usability Workshop • NEES IT Managers’ Retreat • Meetings • SEEK All-Hands Meeting • NEON CI Planning Workshop • The NEURON Simulation Environment • Metagenomics 2006 • BIRN All-Hands Meeting • Information Theory and Applications Workshop • ORION Coastal/Global RFP meeting • Geoinformatics 2007 • Governor’s Broadband Taskforce Meeting • Moore Foundation Annual Marine Microbiology Investigator Symposium • Site Visits • NEESit NSF Site Visit • LOOKING NSF Review Meeting • Calit2 UCOP Review • NEON NSF Conceptual Design Review
Staffing and Funding • Staffing • Technical Support Staff • Research Staff: Visualization, Data Integration, Analysis, Data Mining • Coordination • Funding • “Project-based” funding: Staff funded by research projects • “Recharge”: Facility usage fee
Calit2 Stereo Wall (C-Wall) • Dual HD resolution (1920 x 2048 pixels) with JVC HD2k projectors • 2 Linux PCs w/Nvidia Quadro 5600 • Passive stereo • Ascension Flock of Birds tracking system w/Wanda
Calit2 Stereo Wall (C-Wall) Philip Weber exploring a multi-spectral DaVinci painting
Calit2 Digital Cinema Theater 200 Seats, 8.2 Sound, Sony SRX-R110, SGI Prism w/21TB, 10GE to Computers/Data
Computers: 15 Dell XPS PCs with Quad Core Intel CPUs OS: CentOS Linux Graphics cards:2 Nvidia Quadro 5600 per node Projectors: 30 JVC HD2k (1920x1080 pixels), ~30 megapixels per eye Stereo: passive with circular polarization filters 15 screens, ~8 x 4 feet each Optical tracking system by ART Visualization software:COVISE, OpenSceneGraph Programming Language: C++ The StarCAVE
The Varrier Wall • 12 x 5 array of autostereoscopic displays from EVL • 15 Linux PCs with Nvidia GeForce 7900 graphics cards • 1600 x 1200 pixels on each display • Optical tracking