Download
1 / 34
340 likes | 547 Views
Matlab Tutorial. Session 1 Basics, Filters, Color Space, Derivatives, Pyramids, Optical Flow. Gonzalo Vaca-Castano. Matlab Tutorial. Session 1. BASICS. Introduction to mathematical programming. Commonly used coding/computing environment in research: MATLAB (Matrix laboratory)

E N D
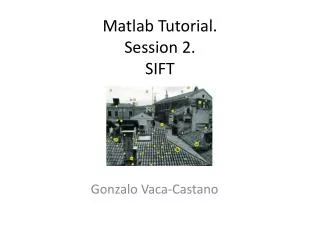
Matlab Tutorial.Session 1Basics, Filters, Color Space, Derivatives, Pyramids, Optical Flow Gonzalo Vaca-Castano
Matlab Tutorial. Session 1 BASICS
Introduction to mathematical programming • Commonly used coding/computing environment in research: MATLAB (Matrix laboratory) • Ideal for numerical computation • Easy to learn • No compiling hassles • Quick testing of ideas! • Helpful tools and tricks for engineers/researchers • Execution of tasks on command prompt
Matlab Layout Current directory
Basic math operations • DMAS : ‘/’ ‘*’ ‘+’ ‘-’ • Exponents: ‘^’ • Trigonometric operations • sin, asin • cos, acos • tan, atan
Matrices • Creating a matrix: • Example: >> [1 1; 0 1] • Matrix operations • Addition, multiplication, inverse, transpose • ‘+’ , ‘*’ , inv() , ‘
Vectors • Creating vectors: • example: >> [1 2 3 4 5] • Vector operations: • Dot product: ‘.’ • Sum all elements: sum() • Sort elements: sort() • Find histogram of elements: hist() • Find average of elements: mean()
Solving a system of linear equations • a=[3 2 1; -1/2 2/3 -1; 1 -2 1] • b=[0;1/2;-1] • c=inv(a)*b; • Output: c= [-0.1429; 0.3214; -0.2143]
Image • 2-D array of numbers (intensity values, gray levels) • Gray levels 0 (black) to 255 (white) • Color image is 3 2-D arrays of numbers • Red • Green • Blue
Example: Removing noise % Create a noisy image I = imread('eight.tif'); imshow(I) J = imnoise(I,'salt & pepper',0.02); figure, imshow(J) % Mean filter K = filter2(fspecial('average',3),J)/255; figure, imshow(K) %Median filter L = medfilt2(J,[3 3]); figure, imshow(L)
Matlab Tutorial. Session 1 Color spaces: Rgb,HSV, etc
Image Architecture • Raster Images (RGB, Gray Scale, Logical) (8-bit representation of gray scale) Single depth Row 3 Row Row 2 Row 1 3 depths Gray Scale (0 – 255) Col (1-bit representation of black or white saturation) B (0 – 255) G (0 – 255) (8-bit representation of colors) R (0 – 255) Logical (0 0r 1)
RGB space • >> I = imread('board.tif') • Displaying image: • >> imshow(I) • Check image size • >> size(I) • Convert color image to black and white image: • >> rgb2gray(I) • % Gray= 0.2989 * R + 0.5870 * G + 0.1140 * B
Other Color spaces http://en.wikipedia.org/wiki/HSL_and_HSV • rgb2hsv(I) • rgb2ycbcr(I) • rgb2ntsc (I) CIELAB or CIECAM02
Derivatives (Filters) • In a continuos 1d Signal, derivative is: • limdx->0 f(x+dx)-f(x)/dx • In a discrete 1d signal, derivative is: • f(x+1)-f(x) • It is a convolution with the filter: • Other popular filter is: Sobel Filter
Derivatives in 2D KERNEL - [1 -1] - - - - - - - [1 -2 1] - - - [1 -2 1]’ - - - - 0 1 0 1 -4 1 0 1 0 -
Derivatives in Matlab I = imread('trees.tif'); imshow(I) k1=[ 1 0 -1;2 0 -2; 1 0 -1] o=imfilter(double(I),k1,'same'); figure; imagesc(o) colormap gray QUESTION:Whyimagesc instead of imshow ?
Pyramid • Definition: • is a type of multi-scale signal representation in which a signal or an image is subject to repeated smoothing and subsampling
Smoothing L is a blurred image - G is the Gaussian Blur operator - I is an image - x,y are the location coordinates - σ is the “scale” parameter. Think of it as the amount of blur. Greater the value, greater the blur. - The * is the convolution operation in x and y. It “applies” gaussian blur G onto the image I
Smoothing function % gauss_filter: Obtains a smoothed gaussian filter image % - Output: % smooth: image filter by a gaussian filter % - Input: % image: Matrix containing single band image. % sigma: Value of the sigma for the Gaussian filter % kernel_size: Size of the gaussian kernel (default: 6*sigma) function [smooth]= gauss_filter(image,sigma,kernel_size) if nargin < 2 sigma=1; end if nargin < 3 kernel_size=6*sigma; end gaussian_radio=floor(kernel_size/2); %radio of the gaussian x=[-gaussian_radio : gaussian_radio]; % x values (gaussian kernel size) gaussiano= exp(-x.^2/(2*sigma^2))/(sigma*sqrt(2*pi) ); %calculate the unidimensionalgaussian temp=conv2(double(image),double(gaussiano),'same'); smooth=conv2(double(temp),double(gaussiano'),'same'); end
Example smoothing I = imread('eight.tif'); imagesc(I); colormap gray; antialiassigma=2; Ismooth=gauss_filter(I,antialiassigma,11); figure; imagesc(Ismooth); colormap gray;
Subsampling I0 = imread('cameraman.tif'); I1 = impyramid(I0, 'reduce'); I2 = impyramid(I1, 'reduce'); I3 = impyramid(I2, 'reduce'); imshow(I0) figure, imshow(I1) figure, imshow(I2) figure, imshow(I3) See also: imresize
Optical flow • Definition • Optical flow or optic flow is the pattern of apparent motion of objects, surfaces, and edges in a visual scene caused by the relative motion between an observer (an eye or a camera) and the scene
Optical Flow code (Download it from webpage) i1=imread('view1.png'); i2=imread('view5.png'); [u,v,cert] =HierarchicalLK(rgb2gray(i1),rgb2gray(i2),3,2,2,1) flowtocolor(u,v)