1 / 0

Sustrans works in three ways

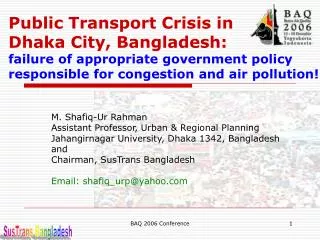
Sustrans works in three ways. by making local environments safer and more attractive for walking and cycling by supporting and encouraging individuals to make more sustainable travel choices by influencing policy and practice.

gada
Download Presentation

Sustrans works in three ways

An Image/Link below is provided (as is) to download presentation Download Policy: Content on the Website is provided to you AS IS for your information and personal use and may not be sold / licensed / shared on other websites without getting consent from its author. Content is provided to you AS IS for your information and personal use only. Download presentation by click this link. While downloading, if for some reason you are not able to download a presentation, the publisher may have deleted the file from their server. During download, if you can't get a presentation, the file might be deleted by the publisher.

E N D

Presentation Transcript


  1. Sustrans works in three ways by making local environments safer and more attractive for walking and cycling by supporting and encouraging individuals to make more sustainable travel choices by influencing policy and practice.
  2. Development of the National Cycle Network1992-early work 1995’s target 2,500 2000 achieved 5,000
  3. 2001 2002 2003 2004 2005 2006 2007 2008 2000 The National Cycle NetworkOpen National Route
  4. National Cycle Network in Wales 29 millionwalking and cycling trips on the Network in Wales last year potential carbon saving of these trips is over 63,000 tonnes a year, valued at £3.2 million The health benefits of cycling on the Network in Wales in 2009 were worth£20.5 million
  5. Priority VCN schemes
  6. Pentrebach Underpass
  7. Section of Mural Design for Pentrebach Underpass created by local community arts group
  8. Lost four stone Ditched post-op crutches and stick within a month Blood pressure dropped dramatically
  9. 87% of residents now say the street is safe for children, compared to just 11% before 33% of residents now spend more time with their neighbours.
  10. Passenger transport purpose (all modes)
  11. Estimated CO2 emissions by journey purpose
  12. Decarbonising local travel 55% of UK total transport emissions come from personal car use 20% of CO2 emissions arise from journeys that are less than 5 miles More than half of all car journeys are under 5 miles Only 2% of journeys under 5 miles are currently cycled On average we each travel 1,300 journeys a year that are under 5 miles
  13. Case Study 1 TravelSmart
  14. TravelSmart - a brief history Based on approach pioneered by Socialdata in late 1980s to promote public transport First extended to include walking and cycling as part of TravelSmart programme in Perth, Western Australia Introduced to UK in 2001 by Sustrans in partnership with Socialdata Now delivered 29 projects helping more than 250,000 people to travel more sustainably
  15. Why does TravelSmart work? Designed to directly address individual subjective barriers that prevent greater use of sustainable travel Focused on enabling (not telling) people to change behaviour, when and where it suits them best Multi-stage dialogue allows for varying levels of engagement Customer focus results in unique experience for every participating household Addresses all travel purposes
  16. Target population Personal contact (65-95%)by phone or on the doorstep Regular user (~10%) of sustainable modesw/out info needs Regular user (~15%) of sustainable modes with info needs Interested (~50%) in using sustainable modes Not Interested (~25%) in using sustainable modes Rewardonly Information pack(+ reward for regular users) Eco-driving info/no further contact Personal delivery Personal delivery By post Home advice session The TravelSmart process
  17. TravelSmart outcomes completed projects (2006-10) Target population (households) Sustainable travel modes Car-as- driver trips Location Date
  18. TravelSmart carbon outcomes Savings ranging from 417 to 1,540 car km per household per year Estimated CO2 savings of 85 to 313 kg per year (using 2009 Defra fleet average conversion factor) Peterborough and Worcester TravelSmart delivered annual CO2 savings of 6,412 tonnes and 4,005 tonnes on baseline levels, respectively.
  19. TravelSmart in Wales 100,000 households, over 4 years Sustainable Travel Centres Cardiff Haverfordwest and Carmarthen Aberystwyth Mon a Menai
  20. TravelSmart in Cardiff 63,000 households 52% saturation (AFD) Spring / summer 2011 baseline survey 3 phases household PTP starting Autumn 2011
  21. Case Study 2 Bike It
  22. Creating the low carbonnext generation

    Results for the second year of the project
  23. The school journey School travel is responsible for 20% of peak hour traffic Average distance for primary school journeys is 1.5 miles, for secondary schools 3.3 miles Average car occupancy is one parent and one child
  24. The Bike It approach school staff capacity building pupil responsibilities “Bike It crew” information and supporting resources advice and overcoming barriers embeds a culture of cycling a tailored range of activities, in 4 stages
  25. The four phases of Bike It
  26. Photos of activities Awareness raising – and data collection
  27. Empowerment
  28. Bike breakfast
  29. Curriculum links
  30. Action – bike rides
  31. Action – competitions
  32. Virtual Bike Race 45 schools 709 mile virtual race 5989 pupils journeys 1333 adult journeys
  33. Increase in cycling Approx 650 more pupils cycling regularly
  34. Pupils cycling every day
  35. Reduction in car use 218 fewer pupils being driven every day
  36. Bike It carbon outcomes ?
  37. Useful data sources Carbon Pathways Analysis, DfT 2008 UK Transport and Climate Change data factsheet, DfT 2008 National Travel Survey Stern Review 3 ingredients; carbon pricing, technology and removing barriers to behaviour change Sustrans website
More Related