Download
1 / 18
180 likes | 506 Views
y =. y. c. = x. 4. 7. x. EXAMPLE 1. Classify direct and inverse variation. Tell whether x and y show direct variation, inverse variation, or neither. Type of Variation. Given Equation. Rewritten Equation. a. xy = 7. Inverse. b. y = x + 3. Neither. Direct. y = 4 x.

E N D
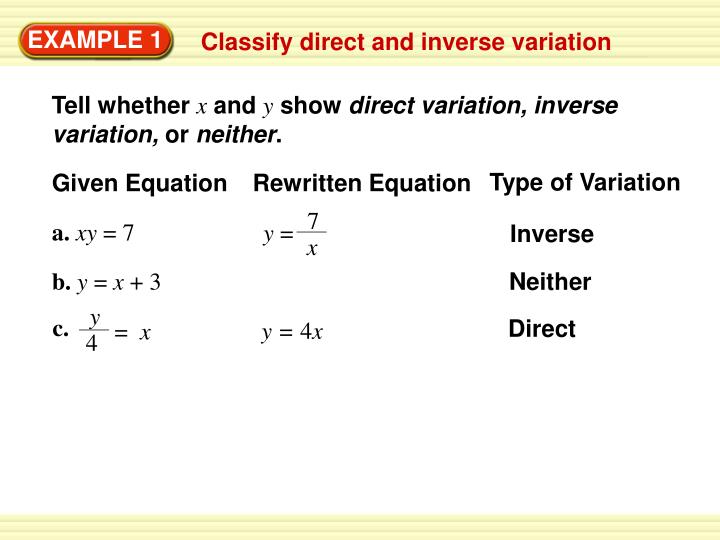
y = y c. = x 4 7 x EXAMPLE 1 Classify direct and inverse variation Tell whether xand yshow direct variation, inverse variation, or neither. Type of Variation Given Equation Rewritten Equation a.xy = 7 Inverse b.y = x + 3 Neither Direct y = 4x
y= 7= ANSWER 28 The inverse variation equation is y = x 28 = –14. Whenx = –2, y = a a –2 4 x EXAMPLE 2 Write an inverse variation equation The variables xand yvary inversely, and y = 7 when x=4. Write an equation that relates xand y. Then find ywhen x = –2 . Write general equation for inverse variation. Substitute 7 for yand 4 for x. 28 = a Solve for a.
MP3Players The number of songs that can be stored on an MP3 player varies inversely with the average size of a song. A certain MP3 player can store 2500 songs when the average size of a song is 4 megabytes (MB). EXAMPLE 3 Write an inverse variation model • Write a model that gives the number nof songs that will fit on the MP3 player as a function of the average song size s(in megabytes).
• Make a table showing the number of songs that will fit on the MP3 player if the average size of a song is 2MB, 2.5MB, 3MB, and 5MB as shown below. What happens to the number of songs as the average song size increases? EXAMPLE 3 Write an inverse variation model
STEP 1 Write an inverse variation model. a n= s a 2500= 4 ANSWER 10,000 s A model is n = EXAMPLE 3 Write an inverse variation model Write general equation for inverse variation. Substitute 2500 for n and 4 for s. 10,000 = a Solve for a.
STEP 2 Make a table of values. ANSWER From the table, you can see that the number of songs that will fit on the MP3 player decreases as the average song size increases. EXAMPLE 3 Write an inverse variation model
STEP 1 Write a general joint variation equation. STEP2 Use the given values of z, x, and y to find the constant of variation a. EXAMPLE 5 Write a joint variation equation The variable z varies jointly with x and y. Also, z= –75 when x = 3 and y = –5. Write an equation that relates x, y, and z. Then find z when x = 2 and y = 6. SOLUTION z = axy –75 = a(3)(–5) Substitute 75 for z, 3 for x, and 25 for y. –75 = –15a Simplify. 5 = a Solve for a.
STEP 3 Rewrite the joint variation equation with the value of afrom Step 2. STEP 4 Calculate z when x = 2 and y = 6 using substitution. EXAMPLE 5 Write a joint variation equation z = 5xy z = 5xy= 5(2)(6) = 60
y = y = z = atr x = s ay a a x2 x x EXAMPLE 6 Compare different types of variation Write an equation for the given relationship. Relationship Equation a.y varies inversely with x. b.z varies jointly with x, y, and r. z = axyr c.y varies inversely with the square of x. d.z varies directly with y and inversely with x. e.x varies jointly with t and r and inversely with s.
a Graph a rational function of the form y = x 6 Graph the function y = . Compare the graph with the graph of y = . x 1 x EXAMPLE 1 SOLUTION STEP 1 Draw the asymptotes x = 0 andy = 0. STEP 2 Plot points to the left and to the right of the vertical asymptote, such as (–3, –2), (–2, –3), (2, 3), and (3, 2).
a Graph a rational function of the form y = x 6 x 1 x The graph of y =lies farther from the axes than the graph of y =. EXAMPLE 1 STEP 3 Draw the branches of the hyperbola so that they pass through the plotted points and approach the asymptotes. Both graphs lie in the first and third quadrants and have the same asymptotes, domain, and range.
a +k Graph a rational function of the form y = x–h – 4 Graph y = –1. State the domain and range. x +2 Plot points to the left of the vertical asymptote, such as (–3, 3) and (– 4, 1), and points to the right, such as (–1, –5) and (0, –3). EXAMPLE 2 SOLUTION STEP 1 Draw the asymptotes x = –2 and y = –1. STEP 2
a +k Graph a rational function of the form y = x–h EXAMPLE 2 STEP 3 Draw the two branches of the hyperbola so that they pass through the plotted points and approach the asymptotes. The domain is all real numbers except – 2, and the range is all real numbers except – 1.
Graph a rational function of the form y = Graph y = . State the domain and range. ax + b 2x + 1 cx + d x - 3 Draw the asymptotes. Solve x –3= 0 for xto find the vertical asymptote x = 3.The horizontal asymptote is the line y = = = 2 a 2 c 1 EXAMPLE 3 SOLUTION STEP 1
Graph a rational function of the form y = STEP 2 ax + b Plot points to the left of the vertical asymptote, such as (2, –5) and , ),and points to the right, such as(4, 9) and( ). cx + d 13 6, 3 1 (0 – 3 ANSWER The domain is all real numbers except 3. The range is all real numbers except 2. EXAMPLE 3 STEP 3 Draw the two branches of the hyperbola so that they pass through the plotted points and approach the asymptotes.
• Write an equation that gives the average cost per model as a function of the number of models printed. EXAMPLE 4 Solve a multi-step problem 3-D Modeling A 3-D printer builds up layers of material to make three dimensional models. Each deposited layer bonds to the layer below it. A company decides to make small display models of engine components using a 3-D printer. The printer costs $24,000. The material for each model costs $300.
Unit cost • Number printed + Cost of printer c = Number printed 300m + 24,000 m = EXAMPLE 4 Solve a multi-step problem • Graph the function. Use the graph to estimate how many models must be printed for the average cost per model to fall to $700. • What happens to the average cost as more models are printed? SOLUTION STEP 1 Write a function. Let cbe the average cost and mbe the number of models printed.
Graph the function. The asymptotes are the lines m =0 and c = 300. The average cost falls to $700 per model after 60 models are printed. EXAMPLE 4 Solve a multi-step problem STEP 2 STEP 3 Interpret the graph. As more models are printed, the average cost per model approaches $300.