Download
1 / 12
120 likes | 248 Views
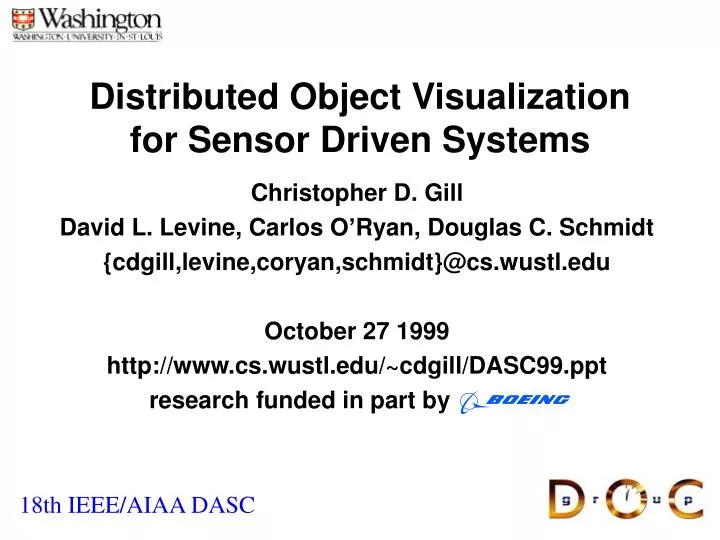
Distributed Object Visualization for Sensor Driven Systems. Christopher D. Gill David L. Levine, Carlos O’Ryan, Douglas C. Schmidt {cdgill,levine,coryan,schmidt}@cs.wustl.edu October 27 1999 http://www.cs.wustl.edu/~cdgill/DASC99.ppt research funded in part by.

E N D
Distributed Object Visualization for Sensor Driven Systems Christopher D. Gill David L. Levine, Carlos O’Ryan, Douglas C. Schmidt {cdgill,levine,coryan,schmidt}@cs.wustl.edu October 27 1999 http://www.cs.wustl.edu/~cdgill/DASC99.ppt research funded in part by
Research Objectives • Research • Identify key design forces and requirements for visualizing sensor driven systems • Prototype extensions to the TAO DOVE framework that resolve these key design forces • Identify characteristics of a class of sensor-driven applications that can be represented by a non-proprietary algorithm distributed through an open source model • Technology Demonstration • Implement sample non-proprietary components, algorithms that represent this class of sensor driven applications • Demonstrate the ability to visualize the activities and performance characteristics of the sample application, using the extended DOVE framework
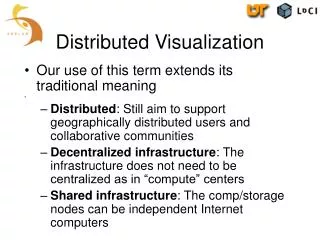
Design Forces and Requirements • Unobtrusive Visualization • Data collection,visualization must not interfere excessively with timing behavior • Visualizing Non-deterministic Behavior • Total load on the system, effects of load on individual components • Hybrid static/dynamic priority model • Visualizing Distinct Streams • Data and performance may differ even between instances of same component
Design Forces Resolved • Unobtrusive Visualization • Use the Adapter, Observer, and Mediator patterns to isolate application components from the visualization framework • Use inline methods to reduce data collection overhead • Run much of visualization framework remotely
Design Forces Resolved • Visualizing Non-deterministic Behavior • Monitor individual components using adapters: execution time, execution jitter in each component • Coordinate adapters to measure end-to-end behavior: latency, latency jitter, laxity, missed deadlines, preemption
Design Forces Resolved • Visualizing Distinct Streams • Capture data and performance differences between components though a separate adapter for each • De-multiplex visualization events onto different displays according to adapter, component, priority, etc.
Characterizing a Class of Applications • Algorithms that decompose into discrete steps ... • quality monotonic, e.g., image load • ... that have at least some time critical steps ... • e.g., enforce lower bound on progress • ... and that benefit from additional optional steps • work ahead to cushion delays later • improve ultimate quality of solution • complete sooner to yield resources
Open Source Implementation • “Persian” Recursion algorithm is representative and suitable for open source distribution • A. Burns, “”Persian” Recursion”, Mathematics Magazine, vol. 70, no. 3, MAA, 1997 • Two flavors of the “Persian” Recursion reflect variations in solution convergence for the class of applications • detail first • coverage first
Open Source Implementation • Depth first recursion models “detail first” algorithms • Provides complete detail for a localized view of the complete computation • Successive refinement fills in a broader and broader view • Use for applications where good local information is more important than global view • e.g., some cache coherency approaches, logical clocks, etc.
Open Source Implementation • Breadth first recursion models “coverage first” algorithms • Provides limited detail for a complete view of the computation • Successive refinement fills in more and more layers of detail • Use for applications where global information is more important than a localized view • e.g., image quality during download, some navigation approaches, etc.
Demonstration Software • Work in progress • C++ event suppliers perform DF or BF recursion, send line segment events • Visualization components receive line segment events and use them to paint images you see, using Java AWT • Performance monitoring being debugged on NT, then tested on Linux and a few RTOS endsystems • Coming soon to a beta near you • I.e., TAO 1.0.8 or TAO 1.0.9 (November 1999) • $TAO_ROOT/examples/Simulator
Concluding Remarks • Key design forces and requirements include • unobtrusive visualization, visualizing non-deterministic behavior, and visualizing distinct streams • These forces and requirements are resolved by • Using design patterns to decouple application from framework • Adding new monitoring capabilities to the DOVE framework • The “Persian” Recursion example demonstrates DOV techniques for a class of sensor driven applications • Look for the demo source and additional information • http://www.cs.wustl.edu/~schmidt/{ACE,TAO}.html • http://www.cs.wustl.edu/~cdgill/DASC99.{ppt,doc}