Download
1 / 18
180 likes | 414 Views
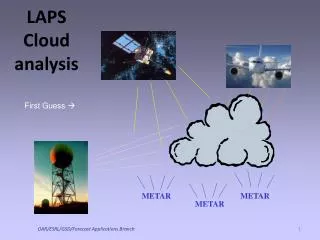
LAPS __________________________________________ Analysis and nowcasting system for Finland/Scandinavia. Finnish Meteorological Institute Erik Gregow. The Local Analysis and Prediction System (LAPS) at FMI:

E N D
LAPS __________________________________________ Analysis and nowcasting system for Finland/Scandinavia Finnish Meteorological Institute Erik Gregow
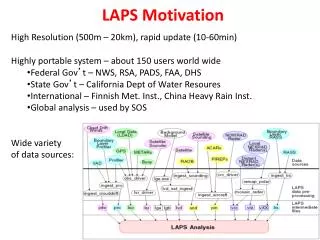
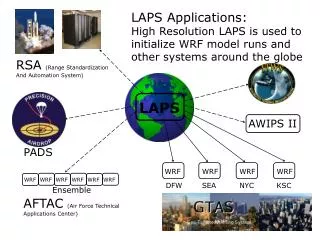
The Local Analysis and Prediction System (LAPS) at FMI: LAPS (ver. 0-41-0) is running operationally at CRAY computer Operational domains: • Scandinavia area: Resolution 3 km, 490*560 gp (runtime: ~20 min) • Finland area: Resolution 3 km, 270*400 gp (runtime: ~10 min) • Helsinki Capital City area: Resolution 1 km, 400*300 gp (runtime: ~10 min) Vertical resolution: 44 levels, higher resolution (10 hPa) at lower altitudes Temporal resolution: 3D-analysis of atmosphere at Every hour LAPS output format: NetCDF, conversion to GRIB2 and GRIB1
LAPS domains: Animations at webpages: LAPS Scandinavia domain, 3 km: http://testbed.fmi.fi/WORK_AREA/history_browser-laps-Scandinavia.php LAPS Finland domain, 3 km:http://testbed.fmi.fi/history_browser-laps-finland-public.php LAPS Helsinki domain, 1 km: http://testbed.fmi.fi/WORK_AREA/history_browser-laps.php Google maps (domains & stations): http://maps.google.com/maps/ms?ie=UTF8&hl=en&msa=0&msid=117681613455951154926.000490ea9e7d88a840913&ll=63.352129,24.521484&spn=18.203934,28.256836&z=5 LAPS Scandinavia domain, 3 km resolution LAPS Finland domain, 3 km resolution LAPS Helsinki domain, 1 km resolution
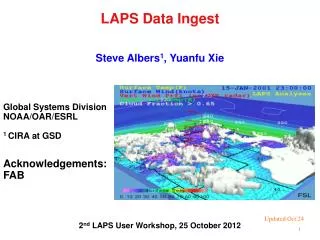
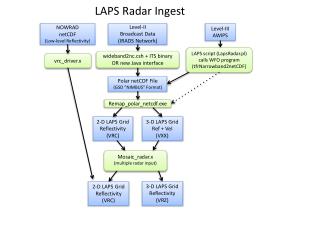
Scandinavia domain, 3 km resolution ECMWF (HIRLAM) Background model L A P S 3D - A N A L Y S I S Web pages Meteosat9: 5 Ch (NOAA: 3 Ch) Satellite SMARTMET visualization & editor system 8 Radar stations (only Finnish) Radar Verification Road Weather obs ~400 Stations Air-Quality model ~650 / ~90 Station obs. Synop/Metar 14 Sounding stations Sounding Specified endusers ~30 depends on air-traffic AMDAR/AIREP Road Weather model Local SFC-stations ~120 stations
Modifications/Developments done to LAPS version 0-41-0 Setup at Altix- and Cray- computer facilities New code to ingest background fields from ECMWF New satellite ingest (code from METEOCAT, Spain) Modifications to cloud analysis: • Use of only IR-channels • Detection of low clouds during winter time 1 hour precipitation accumulation analysis Precipitation form: Looking into the ‘freezing precip.’ products Implemented into FMI workstation SMARTMET (visualization and editor system)
Modifications to cloud analysis; The usage of IR-channels Note: Finland is situated at high latitudes, 60-70 degrees north Use of only the 4 IR channels from Meteosat-9 (MSG9), not using VIS-channel Avoid 'cuts' during dusk and dawn where different codes are used to analyze clouds from IR- and VIS-channels To get a smoother transition between the analysis hours With VIS-channel it is difficult to distinguish between low clouds and snow cover, problem how to use the information from Albedo New range of 'thresholds' (IR3.9 - IR11.2) gives a good capture of clouds, both low-, middle- and high clouds I created new 'thresholds' based on measurements of satellite & surface temperatures.....
Example of modified cloud analysis: /src/cloud/get_istat_39.f t39_diff = t39_k(i,j) - tb8_k(i,j) istat_39_a(i,j) = 0 if( 1 (t39_diff .le. -6.5 .and. 1 rlaps_land_frac(i,j) .gt. 0.5 .and. ! Land 1 t_sfc_k(i,j) .gt. 275.15) )then istat_39_a(i,j) = +1 ! Got cloud elseif( 1 (t39_diff .le. -6.0 .and. 1 tb8_c .gt. -3.5 .and. 1 rlaps_land_frac(i,j) .gt. 0.5 .and. ! Land 1 t_sfc_k(i,j) .le. 275.15 .and. 1 t_sfc_k(i,j) .gt. 270.15) )then istat_39_a(i,j) = +1 ! Got cloud elseif( 1 (t39_diff .le. -6.8 .and. 1 tb8_c .le. -3.5 .and. 1 rlaps_land_frac(i,j) .gt. 0.5 .and. ! Land 1 t_sfc_k(i,j) .le. 270.15 .and. 1 t_sfc_k(i,j) .gt. 259.15) )then istat_39_a(i,j) = +1 ! Got cloud ........................... ......more....... ............... ......... if(t39_diff .gt. +5.0 .and. t39_diff .lt. +25. 1 .AND. tb8_c .gt. -25. 1 .AND. rlaps_land_frac(i,j) .gt. 0.5)then ! land if(t_sfc_k(i,j) .gt. 291.15)then istat_39_a(i,j) = +1 ! got cloud endif endif if(t39_diff .gt. +0.0 .and. t39_diff .lt. +25. 1 .AND. tb8_c .gt. -25. 1 .AND. rlaps_land_frac(i,j) .gt. 0.5)then ! land if(t_sfc_k(i,j) .le. 291.15 .and. 1 t_sfc_k(i,j) .gt. 278.15)then istat_39_a(i,j) = +1 ! got cloud endif endif .............................. .......more....... .......... .......
Modifications to cloud analysis; Detection of low clouds in wintertime Determine the cloud top of low clouds, during winter time, is difficult! In Finland high frequency of low clouds in shallow inversions Cloud top temperature is many times mismatched to the 3D-temperature profile and the cloud top is placed at too high altitudes Added code to detect shallow inversions, if some criteria is fulfilled → cloud top is placed at inversion height
Clouds in temperature inversion: /src/cloud/insertsat.f temp_above = temp_3d(i,j,klaps-5) do kl = klaps-6,k_terrain+1,-1 if( ((temp_above - temp_3d(i,j,kl)) * 1 (temp_3d(i,j,kl) - temp_3d(i,j,kl-1)) .lt. 0.) ! Inversion 1 .AND. 1 (temp_3d(i,j,kl-1) - 10 .lt. cldtop_temp_k) ) then ! Criteria arg = heights_3d(i,j,kl) if(arg .ge. topo)then cldtop_tb8_m = arg if(arg .le. 600)then thk_def = 300 elseif(arg .le. 900)then thk_def = 600 elseif(arg .le. 1200)then thk_def = 900 elseif(arg .le. 1500)then thk_def = 1200 endif goto1019 endif endif temp_above = temp_3d(i,j,kl) enddo
Improved cloud analysis: Night time clouds, example plot from SMARTMET March 15, 00UTC Meteosat9: IR-channels LAPS: Cloud analysis (total amount frac.)
Example plot from SMARTMET visualization tool LAPS cross-section: Cloud frac. + Icing index LAPS: Cloud analysis (total amount frac.)
Precipitation accumulation: A 'bias_ratio' value is used to correct the accumulation (through 'barnes multivariate analysis') bias_ratio = observation / radar (radar converted to precip. rate) If bias_ratio < 0.5 or bias_ratio > 2.0 then not used Limitations when observations differs to much from radar estimates • I have observed problems but done minor modification to code How to take into account as many observations as possible ? Problems with overestimation/underestimation when spread to neighboring points
Modifications to precipitation accumulation: /src/accum/blend_gauge_data.f if(l_accum_bias_ratio .and. n_msg_rdr_bkg .eq. 0)then if(pcp_gauge(iob) .gt. 0. .AND. 1 pcp_laps_in .ne. r_missing_data .AND. 1 pcp_laps_in .gt. 0.)then bias_ratio = pcp_gauge(iob) / pcp_laps_in if(bias_ratio .ge. 0.25 .AND. 1 bias_ratio .le. 4.0 )then pcp_gauge(iob) = bias_ratio elseif(bias_ratio .gt. 4.0 .AND. 1 bias_ratio .le. 100.0 )then pcp_gauge(iob) = 4.0 elseif(bias_ratio .ge. 0.0 .AND. 1 bias_ratio .lt. 0.25 )then pcp_gauge(iob) = 0.25 else pcp_gauge(iob) = badflag endif else pcp_gauge(iob) = badflag endif endif
Planned developments: Setup of a rapid update cycle (RUC) system, consisting of: HIRLAM – LAPS – HARMONIE HIRLAM is numerical weather prediction (NWP) model for the synoptic scale, used mainly within European countries??? HARMONIE is mesoscale NWP model, used mainly within European countries http://hirlam.org/
Example of planned short range, high resolution forecast system HIRLAM 15 km Observations Cycle time: every 6 hour LAPS 2.5 km HARMONIE 2,5 km • Nowcasting and shortrange forecasts • ”Hot-start” of HARMONIE • Forecasts fast available and updated frequently - Fills a ”gap” in FMI NWP Forecast 6-12 hours
Example of planned short range, high resolution forecast system HIRLAM 15 km Observations Cycle time: every 6 hour LAPS 2.5 km Alternative Cycle time: Every 3 hour HARMONIE 2,5 km • Nowcasting and shortrange forecasts • ”Hot-start” of HARMONIE • Forecasts fast available and updated frequently - Fills a ”gap” in FMI NWP Forecast 6-12 hours
Evaluation/Verification of LAPS products: • FMI NWP verification system (where HIRLAM/AROME are verified) • Verification against surface stations: http://meteor.fmi.fi/verif/ • Evaluation by forecasters (general-, aviation-, commercial- forecasters) Questionnarie: https://www.webropol.com/P.aspx?id=284014&cid=34950615
LAPS __________________________________________ Analysis and nowcasting system for Finland/Scandinavia Finnish Meteorological Institute Erik Gregow