Download
1 / 17

E N D
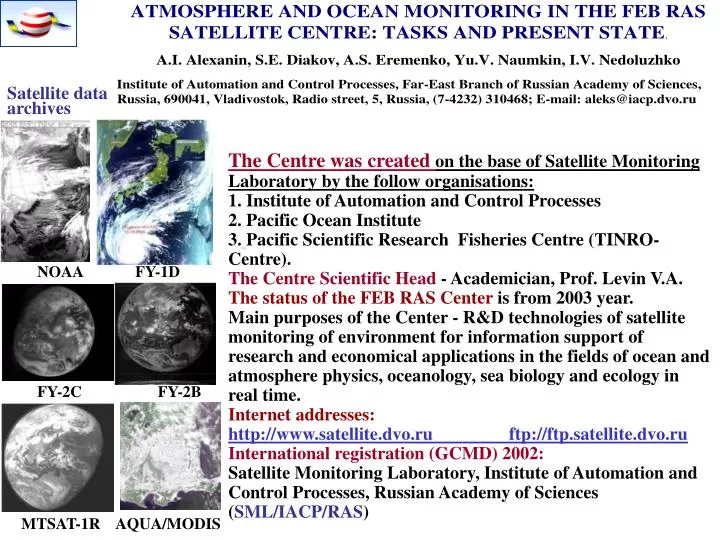
Satellite data archives The Centre was created on the base of Satellite Monitoring Laboratory by the follow organisations:1. Institute of Automation and Control Processes2. Pacific Ocean Institute 3.Pacific Scientific Research Fisheries Centre (TINRO-Centre).The Centre Scientific Head- Academician, Prof. Levin V.A.The status of the FEB RAS Center is from 2003 year.Main purposes of the Center - R&D technologies of satellite monitoring of environment for information support of research and economical applications in the fields of ocean and atmosphere physics, oceanology, sea biology and ecology in real time. Internet addresses:http://www.satellite.dvo.ru ftp://ftp.satellite.dvo.ruInternational registration (GCMD) 2002: Satellite Monitoring Laboratory, Institute of Automation and Control Processes, Russian Academy of Sciences (SML/IACP/RAS) NOAA FY-1D FY-2C FY-2B MTSAT-1RAQUA/MODIS
Development directions Main directions: 1. Provision of necessary data sources reception. 2. Automation the data processing. 3. New technology creation for ocean and atmosphere monitoring. Tasks are form the Centre functions and the basic set of the data sources. Activity kinds 1. Data reception, acquisition, delivery. 2. Automation of data processing and integration in the global information systems. 3. Primary processing - data correction, calibration, navigation. 4. Thematic processing - new algorithm creation for ocean and atmosphere parameterestimation.
Main application tasks of the Satellite Centre Software and technologies: Applied packages: AAPP, RTTOV, SSMIS-1Dvar (MetOffice, UK), SeaDAS and IMAPP (USA). Own software: NOAA/NESDIS, JMA and own methods. DATA SOURCES (RT or near RT; modern state ) AQUA/MODISAQ UA/AMSR-E NOAA&METOP/AVHRRNOAA&METOP/ATOVSMTSAT-1RFY-2CFY-1DASCAT/METOPALTIMETERAEROLOGY 1 2 3 4 5 6 7 8 9 10 Main taskswhich are formingthe Centre development, necessary data sources (numbers); international projects which influence on the task solution Temperature and structure of the sea surface 1,2,3,5,6,7,8,9 UNESCO/IOC/WESTPAC, Atmosphere remote sensing and typhoon nowcasting 1,2,4,5,6,8,10 A-P RARS Volcano and fire monitoring 1,3,7 Ecology, sea primary productivity 1,4,8 UNEP/ NOWPAP/CEARAC Monitoring of flooding 1,3,5,6,7
Samples of the satellite products Sea surface temperature in colors and isolines Flow current vectors Fishing season for pacific saury. Comfortable conditions for the fish: - T~10-13C - thermal front - following flow Triangles are the fine catches SST and thermal surface structure charts
FY-1d calibration parameters. FY-1C/D. Main unsolved problems: 1. Different FY-1D sensor orientations. 2. No calibration of IR-channels. 3. Feasibility of chlorophyll-a estimation by FY-1D data. FY-1D, RGB image FY-1d inter-calibration with NOAA/AVHRR data RMSCH4=0.3° C MCSST=a0 + a1 t4 + a2 (T4-T5) + a3 (T4-T5) (sec()-1) day: a0=-254.8 a1=0.934 a2=2.55 a3=-0.24 night: a0=-255.7 a1=0.938 a2=2.34 a3=-0.44 RMSCH5=0.5 °C RMS=0.71°C Verification of FY-1d MCSST
SST retrieval from FY-1D imagery SST charts: NOAA-17 (left) and FY-1D (right). Chl-a estimation on FY-1D imagery (atmosphere correction is unsolved problem now) SeaWifs, chlorophyll-a estimation (SeaDAS, OC2 ) Sangar Strait, Hokkaido island. FY-1D, R8/R9 8 (0.48-0.53 мкм) и 9 (0.53-0.58 мкм)
MTSAT-1R Problems: 1. Standard navigation algorithm has an error up to 10 km. 2. JMA SST charts have calibration with in situ data twice a day and follow errors: bias~0.5° RMS~1.2 ° Demands to SST quality: no bias, RMS<0.8°. The relations between NOAA-MTSAT temperature differences from brightness temperature of MTSAT for different scan angles. Channel 10.5mkm NOAA-18 SST (left) and MTSAT-1R SST (right) on 11, April2007 Sensor peculiarities and task solution results: 1. Visible and IR-sensors have different axes and their images should be navigated separately 2. The correction of two angles of platform orientation is sufficient to make navigation with 1 pixel accuracy. 3. IR-sensors have more sensitivity to scan angle when NOAA/AVHRR ones. It is better to make preliminary correction radiation temperature of each channel. 4. It is possible for Far Easter region to use NOAA/NESDIS formula for MCSST to compute SST with cross-calibration error 0.4°(RMS).
Algae species detection The task– to detect algae species and biomass concentration with the data of MODIS radiometer Chlorophyll-a concentration on 08.31.2006 Radiation variability of a channelk: Rk-Rw=Ci·Ri,k , where Rw – pure water radiation; Ci – concentration of an algae i; Ri,k – irradiation of an algaei for channelk. Algae concentration estimated on 08.31.2006 CO DB Irradiation characteristic of the algae: CO -Coscinodiscus oculus-iridis ; DB - Ditylum brightwellii
Altimeter data use Jason-1 , Topex/Poseidon – synchronous tracks with the distance between them is near 150 km ftp://podaac.jpl.nasa.gov/pub/sea_surface_height/jason/ Level measured - H=H0+h+, whereH0 – average height, ssh – height anomaly, - accuracy (3-4 cm) Main problem – the absence of the accurate geoid IR-image on 09.30.01 with the structure chart Wind field calculated by absolute sea level (siteAVISO) Artefacts – the absence of the main stationary currents – Soya, Oyasio, East-Sakhalin currents
Absolute dynamic topography estimation The approach selected - to use flow lines estimated with thermal structure charts. Let’s a flow line cross two altimeter tracks at points X1 and X2, when ssh1+gh1=ssh2+gh2, wheressh1 и ssh2 – height anomalies, gh1 gh2 – the geoid correction values An eddy and its “flow lines” on April 2004. White sections connect points with the same value of the sea level a b c SST and flow lines (a) anomaly differences (b) geoid correction (c)
Automatic eddy detection The algorithm: 1. Eddy center estimation by the thermal charts. Circular model of the flow is used.False center deleting. 2. Eddy boundary estimation (initial approximation). 3. Eddy contour computation and its center correction. False eddy deleting. 4. Computation the form of eddy circulation on the base of elliptic model. Eddies detected automatically. White squares - possible eddy centers, white ellipsis – initial approximation of the eddy forms,black ones – the result of an optimization procedure. Thermal structure and sea surface velocity estimations by satellite IR-images.
Eddy contour computation The algorithm: Input – the initial contours and the eddy centers 1. Computation of the dominant passing through the segments and contour points correction to minimize the passing. Recalculation the eddy center location if it necessary. 2. If it possible to decrease the passing? If yes – go to step1. 3. Increase the contour point number. If the criteria of the procedure finishing are not carried out – go to step1. 4. Contour analysis and false eddy deleting. Possible eddy centers (left) and its initial contours (right) An eddy contour after the minimization procedure
Typhoon parameter estimation • The final goal – to estimate maximum potential intensity of a typhoon if • it will has overcame “the Japan island shield”. • Automatic typhoon track computation: • Eye size and center location estimation on the base of t-criterion for separability of two fields with different brightness characteristics. Circular model of the eye. • Typhoon center estimation by an analysis of its cloudy structure chart. Circular model is used. • Cycloid parameter estimation • Last two tasks are based on the minimization of the criterion: where N – point number in which we make comparison between model circulation direction and brightness contrast orientation; и - angles of the model and contrast orientation. . Typhoon image Cloudy structure chart Center, eye size, and cycloid estimated
Algorithm verification 155 typhoon images were used for 2001-2003 years(GMS-5) 1. Typhoon center estimation by the eye detection. The eye was detected 85 times and only 3 times the detection was false.The eye was not detected 10 times because of the small size. 2. The analysis of thermal charts allowed to detect all centers. A sample of false eye detection that is controlled by the second algorithm. MTSAT-1R, typhoon CHANCHU, May 2006. Typhoon CHANCHU tracks estimated bythe method, manually, JMAandJWTC. Most images have no eye.
Integration in the portal of Europe Space Agencywith SSE (Services Support Environment) SSE Test Portal Center SSE Toolbox scripts Metadata & data base • SSE • Service-oriented approach to data access • An opportunity to form a set of services for process and deliver the data according a • technology of data processing the user want to use. • SSE is based on he open standards for the data exchange. • The software available for integration in the information system.