Download
1 / 37
370 likes | 415 Views
Chabot Mathematics. §8.3 Quadratic Fcn Graphs. Bruce Mayer, PE Licensed Electrical & Mechanical Engineer BMayer@ChabotCollege.edu. MTH 55. 8.2. Review §. Any QUESTIONS About §8.2 → Quadratic Eqn Applications Any QUESTIONS About HomeWork §8.2 → HW-40. Graphs of Quadratic Eqns.

E N D
Chabot Mathematics §8.3 QuadraticFcn Graphs Bruce Mayer, PE Licensed Electrical & Mechanical EngineerBMayer@ChabotCollege.edu
MTH 55 8.2 Review § • Any QUESTIONS About • §8.2 → Quadratic Eqn Applications • Any QUESTIONS About HomeWork • §8.2 → HW-40
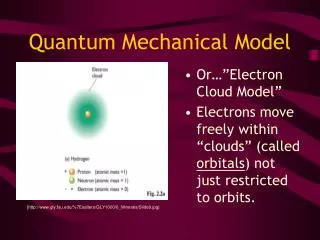
Graphs of Quadratic Eqns • All quadratic functions have graphs similar to y = x2. Such curves are called parabolas. They are U-shaped and symmetric with respect to a vertical line known as the parabola’s line of symmetry or axis of symmetry. • For the graph of f(x) = x2, the y-axis is the axis of symmetry. The point (0, 0) is known as the vertex of this parabola.
Solution:Make T-Table andConnect-Dots y (-2,8) (2,8) 8 7 6 5 4 3 (-1,2 ) 2 (1,2) 1 -5 -4 -3 -2 -1 1 2 3 4 5 -1 x (0, 0) -2 Example Graph f(x) = 2x2 • x = 0 is Axis of Symm • (0,0) is Vertex
Solution:Make T-Table andConnect-Dots y 6 5 4 3 2 1 x -5 -4 -3 -2 -1 1 2 3 4 5 -1 -2 -3 -4 -5 Example Graph f(x) = −3x2 • Same Axis & Vertex but open DOWNward
Examples of ax2 Parabolas 6 5 4 3 2 1
Graphing f(x) = ax2 • The graph of f(x) = ax2 is a parabola with • x = 0 as its axis of symmetry. • The Origin as its vertex. • For a > 0, the parabola opens upward. • For a < 0,the parabola opens downward. • If |a| is greater than 1, the parabola is narrower than y = x2. • If |a| is between 0 and 1, the parabola is wider than y = x2.
The Graph of f(x) = a(x – h)2 • We could next consider graphs of f(x) = ax2 + bx + c, where b and c are not both 0. • It turns out to be convenient to first graph f (x) = a(x – h)2, where h is some constant. • This allows us to observe similarities to the graphs drawn in previous slides.
Solution:Make T-Table andConnect-Dots y 8 7 6 5 4 3 2 1 x -5 -4 -3 -2 -1 1 2 3 4 5 -1 -2 Example Graph f(x) = 2(x−2)2 vertex • The Vertex SHIFTED 2-Units to the Right
Graphing f(x) = a(x−h)2 • The graph of y = f(x) = a(x – h)2 has the same shape as the graph of y = ax2. • If h is positive, the graph of y = ax2 is shiftedh units to the right. • If h is negative, the graph of y = ax2 is shifted |h| units to the left. • The vertex is (h, 0) and the axis of symmetry is x = h.
Graph of f(x) = a(x – h)2 + k • Given a graph of f(x) = a(x – h)2, what happens if we add a constant k? • Suppose we add k = 3. This increases f(x) by 3, so the curve moves up • If k is negative, the curve moves down. • The axis of symmetry for the parabola remains x = h, but the vertex will be at (h, k), or equivalently (h, f(h)) • f(h) = a([h] – h)2 + k = 0 + k → f(h) = k
y 3 2 x 1 -5 -4 -3 -2 -1 1 2 3 4 5 -1 -2 -3 -4 -5 -6 -7 -8 Example Graph • Make T-Table andConnect-Dots vertex • The Vertex SHIFTED 3-Units Left and1-Unit Down
Quadratic Fcn in Standard Form • The Quadratic Function Written in STANDARD Form: • The graph of f is a parabola with vertex (h, k). The parabola is symmetric with respect to the line x = h, called the axis of the parabola. If a > 0, the parabola opens up, and if a < 0, the parabola opens down.
Example Find Quadratic Fcn • Find the standard form of the quadratic function whose graph has vertex (−3, 4) and passes through the point (−4, −7). • SOLUTION: Let y = f(x) be the quadratic function. Then
Graphing f(x) = a(x – h)2 + k • The graph is a parabola. Identify a, h, and k. • Determine how the parabola opens. • If a > 0, the parabola opens up. • If a < 0, the parabola opens down. • Find the vertex. The vertex is (h, k). • If a > 0 (or a < 0), the function f has a minimum (or a maximum) value k at x = h
Graphing f(x) = a(x – h)2 + k • Find the x-intercepts. • Find the x-intercepts (if any) by setting f(x) = 0 and solving the equation a(x – h)2 + k = 0 for x. If the solutions are real numbers, they are the x–intercepts. If not, the parabola either lies above the x–axis (when a > 0) or below the x–axis (when a < 0).
Graphing f(x) = a(x – h)2 + k • Find the y-intercept • Find the y-intercept by replacing x with 0. Then f(0) = ah2 + k is the y-intercept. • Sketch the graph • Plot the points found in Steps 3–5 and join them by a parabola. If desired show the axis of symmetry, x = h, for the parabola by drawing a dashed vertical line
Example Graph • SOLUTION Step 1a = 2, h = 3, and k = –8 Step 2a = 2, a > 0, the parabola opens up. Step 3(h, k) = (3, –8); the function f has a minimum value –8at x = 3. Step 4 Set f (x) = 0 and solve for x.
Example Graph • SOLUTION cont. Step 5Replace x with 0. Step 6axis: x = 3, opens up, vertex: (3, –8), passes through (1, 0), (5, 0) and (0, 10), the graph is y = 2x2 shifted three units right and eight units down.
Example Graph • SOLUTION cont. • Sketch GraphUsing the 4 points • Vertex • Two x-Intercepts • One y-Intercept
Completing the Square • By completing the square, we can rewrite any polynomial ax2 + bx + c in the form a(x – h)2 + k. • Once that has been done, the procedures just discussed enable us to graph any quadratic function.
y 6 5 4 3 2 1 x -5 -4 -3 -2 -1 1 2 3 4 5 -1 -2 -3 -4 -5 Example Graph • SOLUTION f(x) = x2 – 2x – 1 = (x2 – 2x) – 1 = (x2 – 2x + 1 – 1) – 1 = (x2 – 2x + 1) – 1 – 1 = (x – 1)2 – 2 • The vertex is at (1, –2) • The Parabola Opens UP
y 6 5 4 3 2 1 x -5 -4 -3 -2 -1 1 2 3 4 5 -1 -2 -3 -4 -5 Example Graph • SOLUTION f(x) = –2x2 + 6x – 3 CompleteSquare = –2(x2 – 3x) – 3 = –2(x2 – 3x + 9/4 – 9/4) – 3 = –2(x2 – 3x + 9/4) – 3+ 18/4 = –2(x – 3/2)2 + 3/2 • The vertex is at (3/2, 3/2)
The Vertex of a Parabola • By the Process of Completing-the-Square we arrive at a FORMULA for the vertex of a parabola given by f(x) = ax2 + bx + c: • The x-coordinate of the vertex is −b/(2a). • The axis of symmetry is x = −b/(2a). • The second coordinate of the vertex is most commonly found by computing f(−b/[2a])
Graphing f(x) = ax2 + bx + c • The graph is a parabola. Identify a, b, and c • Determine how the parabola opens • If a > 0, the parabola opens up. • If a < 0, the parabola opens down • Find the vertex (h, k). Use the formula
Graphing f(x) = ax2 + bx + c • Find the x–interceptsLet y = f(x) = 0. Find x by solving the equation ax2 + bx + c = 0. • If the solutions are real numbers, they are the x-intercepts. • If not, the parabola either lies • above the x–axis when a > 0 • below the x–axis when a < 0
Graphing f(x) = ax2 + bx + c • Find the y–intercept. Let x = 0. The result f(0) = c is the y-intercept. • The parabola is symmetric with respect to its axis, x = −b/(2a) • Use this symmetry to find additional points. • Draw a parabola through the points found in Steps 3-6.
Example Graph • SOLUTION Step 1a = –2, b = 8, and c = –5 Step 2a = –2, a < 0, the parabola opens down. Step 3 Find(h, k). Maximum value of 3 at x = 2
Example Graph • SOLUTION Step 4Let f (x) = 0. Step 5Let x = 0.
Example Graph • SOLUTION Step 6Axis of symmetry is x = 2. Let x = 1, then the point (1, 1) is on the graph, the symmetric image of (1, 1) with respect to the axis x = 2 is (3, 1). The symmetric image of the y–intercept (0, –5) with respect to the axis x = 2 is (4, –5). Step 7The parabola passing through the points found in Steps 3–6 is sketched on the next slide.
Example Graph • SOLUTION cont. • Sketch GraphUsing the pointsJust Determined
Given the graph of f(x) = −2x2 +8x – 5 Find Domain & Range • Find the domain and range for f(x) • SOLUTION – Examine the Graph to find that the: • Domain is (−∞, ∞) • Range is (−∞, 3]
WhiteBoard Work • Problems From §8.3 Exercise Set • 4, 16, 22, 30 • The Directrix of a Parabola • A line perpendicular to the axis of symmetry used in the definition of a parabola. A parabola is defined as follows: For a given point, called the focus, and a given line not through the focus, called the directrix, a parabola is the locus of points such that the distance to the focus equals the distance to the directrix.
All Done for Today GeometricCompleteTheSquare
Chabot Mathematics Appendix Bruce Mayer, PE Licensed Electrical & Mechanical EngineerBMayer@ChabotCollege.edu –
Graph y = |x| • Make T-table