Download
1 / 6
60 likes | 155 Views
TABULATE doesn’t compute any new statistics, only organizes the output in a nice way… PROC TABULATE; CLASS list_of_classification_variables; TABLE page , row , column ;

E N D
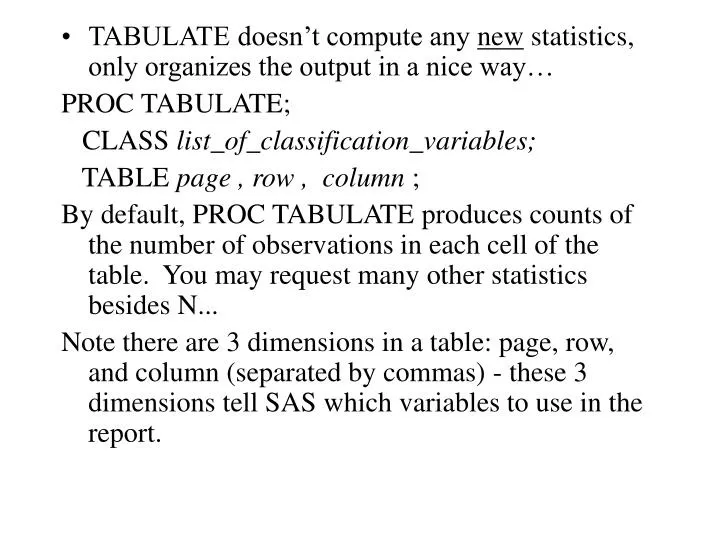
TABULATE doesn’t compute any new statistics, only organizes the output in a nice way… PROC TABULATE; CLASS list_of_classification_variables; TABLE page , row , column ; By default, PROC TABULATE produces counts of the number of observations in each cell of the table. You may request many other statistics besides N... Note there are 3 dimensions in a table: page, row, and column (separated by commas) - these 3 dimensions tell SAS which variables to use in the report.
Suggestion: Start with the column dimension, then add the row then the page. Let’s try these on the padgett dataset... proctabulate; class form flower; table form flower; proctabulate; class form flower; table form,flower; proctabulate; class form flower marsh; table form,flower,marsh; proctabulate; class form flower marsh; table form,marsh,flower; These results are similar to PROC FREQ; To add different statistics to the tables proceed as follows...:
Add a VAR analysis_variables_list; to the PROC TABULATE statement. These variables must be continuous variables as opposed to the categorical variables in the CLASS statement...All variables in the table you want must be listed in either the VAR or CLASS statements. Add a keyword as needed: There are many statistics TABULATE can compute: ALL - totals ; MEAN - arithmetic mean MEDIAN - 50th percentile; N - # of nonmissing SUM - sum or total, etc. - see the list on p. 124 - there are many others too…
There are three ways of getting the statistics: Concatenating: TABLE marsh flower ALL; TABLE marsh ALL, flower ALL; Crossing: TABLE MEAN*plantht; TABLE MEAN*plantht*marsh,flower ALL; Crossing, grouping, concatenating: TABLE MEAN*(flower marsh); Try these out…and the example on page 125…
Silent Lady Maalea sail sch 75.00 America II Maalea sail yac 32.95 Aloha Anai Lahaina sail cat 62.00 Ocean Spirit Maalea power cat 22.00 Anuenue Maalea sail sch 47.50 Hana Lei Maalea power cat 28.99 Leilani Maalea power yac 19.99 Kalakaua Maalea power cat 29.50 Reef Runner Lahaina power yac 29.95 Blue Dolphin Maalea sail cat 42.95 This is the data for the examples on PROC TABLULATE… copy it into a text dataset and read it into SAS as a permanent SAS dataset…
DATA boats; INFILE ‘ ‘; INPUT Name $ 1-12 Port $ 14-20 Locomotion $ 22-26 Type $ 28-30 Price 32-36; * Tabulations with two dimensions and statistics; PROC TABULATE DATA = boats; CLASS Locomotion Type; VAR Price; TABLE Locomotion ALL, MEAN*Price*(Type ALL); TITLE 'Mean Price by Locomotion and Type'; RUN; * run and notice the resulting table… ; * now modify as on p. 127,129, and 130; HW: Read sections 4.12-4.16 and practice PROC TABULATE!