Download
1 / 16
160 likes | 226 Views
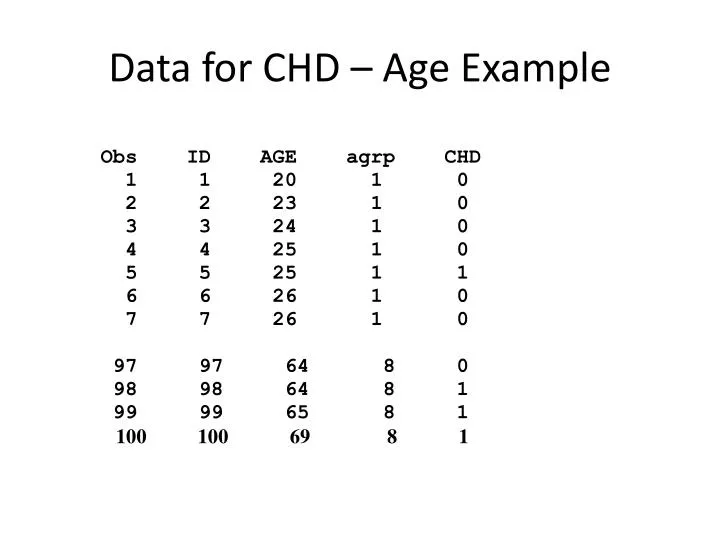
Data for CHD – Age Example. Data for CHD – Age Example. SAS Code CHD – Age Example. proc logistic data=chdage1 covout outest=chdage3 descending; model chd = age; run; quit;. In a study 230 patients were cross classified in respect to disease and risk. 100 130. 120 230.

E N D
SAS Code CHD – Age Example proc logistic data=chdage1 covout outest=chdage3 descending; model chd = age; run; quit;
In a study 230 patients were cross classified in respect to disease and risk 100 130 120 230
SAS Output for Cancer – Smoker Example data SmokeCancer; input Disease Risk count ; cards; 1 1 80 0 1 30 1 0 20 0 0 100 ;run; proclogistic data=SmokeCancer descending; model disease=risk/;freq count; run;
The LOGISTIC Procedure Model Information Data Set WORK.SMOKECANCER Response Variable Disease Number of Response Levels 2 Frequency Variable count Model binary logit Optimization Technique Fisher's scoring Number of Observations Read 4 Number of Observations Used 4 Sum of Frequencies Read 230 Sum of Frequencies Used 230 Response Profile Ordered Total Value Disease Frequency 1 1 100 2 0 130 Probability modeled is Disease=1.
Testing Global Null Hypothesis: BETA=0 Analysis of Maximum Likelihood Estimates Standard Wald Parameter DF Estimate Error Chi-Square Pr > ChiSq Intercept 1 -1.6093 0.2449 43.1685 <.0001 Risk 1 2.5901 0.3253 63.3937 <.0001 Odds Ratio Estimates Point 95% Wald Effect Estimate Confidence Limits Risk 13.332 7.047 25.223