Download
1 / 24
240 likes | 333 Views
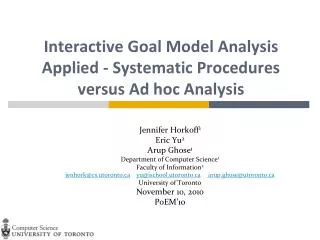
Visualizations to Support Interactive Goal Model Analysis. Jennifer Horkoff 1 Eric Yu 2 Department of Computer Science 1 Faculty of Information 2 jenhork@cs.utoronto.ca yu@ischool.utoronto.ca University of Toronto September 28, 2010 REV’10. Challenges in Goal Models.

E N D
Visualizations to Support Interactive Goal Model Analysis Jennifer Horkoff1 Eric Yu2 Department of Computer Science1 Faculty of Information2 jenhork@cs.utoronto.cayu@ischool.utoronto.ca University of Toronto September 28, 2010 REV’10
Challenges in Goal Models • Goal Models can be used as part of an RE process • Capture and visually present: • Stakeholders • Their needs (goals) • Relationships between goals, and • Stakeholder interdependencies • Show alternative ways to achieve goals (design alternatives) • Analyze the effects of design alternatives • However… • Goal models are often complex and difficult to read • Challenging to following the reasoning through complex paths in the model • Example: inflo Case Study Visualizations to Support Interactive Goal Model Analysis - Horkoff, Yu
Example: inflo Case Study Visualizations to Support Interactive Goal Model Analysis - Horkoff, Yu
Challenges in Interactive Goal Model Analysis • Interactive goal model analysis: • Used to supplement the incomplete nature of the model with stakeholder domain knowledge • Encourages stakeholder participation in modeling and evaluation • Recent studies testing the utility of such evaluation revealed several usability issues (PoEM’10): • Users have difficulty choosing starting points for analysis (initial values) • Users have difficulty understanding conflicts in analysis results • These difficulties can be alleviated with visualization techniques Visualizations to Support Interactive Goal Model Analysis - Horkoff, Yu
Background: Goal Models We use i* as an example goal modeling framework Visualizations to Support Interactive Goal Model Analysis - Horkoff, Yu
Interactive Forward Satisfaction Analysis Human Judgment Human Judgment What if…? • A question/scenario/alternative is placed on the model and its affects are propagated “forward” through model links • Interactive: user input (human judgment) is used to decide on partial or conflicting evidence “What is the resulting value?” • Publications: • CAiSE’09 (short paper) • PoEM’09, • IJISMD Visualizations to Support Interactive Goal Model Analysis - Horkoff, Yu
Interactive Backward Satisfaction Analysis Human Judgment Backtrack Human Judgment Backtrack Conflict Is this possible…? • A question/scenario/constraints are placed on the model and its affects are propagated “backward” through model links • Asks for human judgment “What incoming values could produce the target value?” • Model is iteratively encoded in CNF form and passed to a SAT solver • Publications: • istar’08, • ER’10 Visualizations to Support Interactive Goal Model Analysis - Horkoff, Yu
Qualitative Studies of Interactive Goal Model Analysis • 11 studies were conducted in previous work to the utility of interactive goal model analysis • Ten studies had individuals analyzing models for up to 2 hours • 1 study involved a group implementing the inflo “back-of-the-envelope” calculation modeling tool • Results described in PoEM’10 • Observations pointed to several analysis usability issues • In this work we focus on two issues: initial value selection and conflict comprehension Visualizations to Support Interactive Goal Model Analysis - Horkoff, Yu
Issue #1 Visualizations to Support Interactive Goal Model Analysis - Horkoff, Yu
Issue: Starting Points for Analysis • Users had difficulties knowing how or where to start analysis • When given an analysis question: problems finding intentions to place initial labels • When coming up with their own analysis question: difficulties knowing how to start analysis • Suggested analysis methodology • Start forward analysis by identifying leaf intentions • Start backward analysis by identifying root intentions • All participants using the methodology had difficulties finding roots or leaves • i* models are not like regular tree-shaped graphs: • Some links do not have an obvious direction • Easy to ignore links across actor boundaries • Cycles leads to non-conventional layout Visualizations to Support Interactive Goal Model Analysis - Horkoff, Yu
Challenge: Where are the Leaves and Roots? Example from individual study: conference sustainability PC and Publicity Chair Leaf: an intention that has no “incoming” links Root: an intention that has no “outgoing” links Visualizations to Support Interactive Goal Model Analysis - Horkoff, Yu
Visual Intervention: Automatic Leaf and Root Intention Highlighting OpenOME implementation has “Mark Model Leaves” (green) or “Mark Model Roots” (blue) options Visualizations to Support Interactive Goal Model Analysis - Horkoff, Yu
Issue #2 Visualizations to Support Interactive Goal Model Analysis - Horkoff, Yu
Issue: Understanding Conflicts • Conflict: the case where the SAT solver used in the backward analysis procedure cannot find a solution over a CNF model encoding • For one or more intentions, i, both v(i) and not v(i) hold, where v is an analysis value, e.g. S(i) and not S(i) • “Conflict” in goal modeling is an overloaded term • There is a conflict label, meaning roughly equal amounts of positive and negative evidence • Two alternatives can “conflict” in relation to one goal Visualizations to Support Interactive Goal Model Analysis - Horkoff, Yu
Issue: Understanding Conflicts • We can use the “UNSAT core” to help understand conflicts • UNSAT core: an unsatisfiable subset of clauses in a CNF representing the model • Helps to isolate the intentions involved in the conflict • Previously, we presented the UNSAT core to the user in text form • Users had difficulty understanding the conflict and relating the UNSAT core to the model Visualizations to Support Interactive Goal Model Analysis - Horkoff, Yu
Challenge: Where are the Conflicts? The following intention clauses are conflicting: not PS(Simple functionality) OR PD(Type checking for consistency) not PS(Flexibility) OR PD(Type checking and conversion) not PS(use inflo) OR PS(Graphing) not PS(Graphing) OR PS(Be inflo) not PS(Be inflo) OR PS(Create graphs) not PS(Type checking and conversion) OR PS(Node created automatically) not PS(Type checking and conversion) OR PS(Define types) not PD(Type checking and conversion) OR PD(Node created automatically) OR PD(Define types) not PS(Create graphs) OR PS(Dimensional analysis) not PS(Dimensional analysis) OR PS(Type checking for consistency) OR PS(Type checking and conversion) S(use inflo) PS(Usability for graph creation) not S(use inflo) OR PS(use inflo) not PD(Define types) OR not PS(Define types) not PD(Type checking for consistency) OR not PS(Type checking for consistency) not PD(Node created automatically) OR not PS(Node created automatically) not PS(Usability for graph creation) OR PS(Simplicity of inflo) not PS(Usability for graph creation) OR PS(Flexibility) not PS(Simplicity of inflo) OR PS(Simply functionality) Visualizations to Support Interactive Goal Model Analysis - Horkoff, Yu
Visual Intervention: Conflict Highlighting • Automatically find all intentions involved in clauses in the UNSAT core • Highlight intentions orange in the model • Find the “logical sources of the conflict”, i.e. the intentions for which v(i) is true and not true • Highlight intentions red in the model • Users are presented with a list of intentions involved in the conflict • The assigned analysis value in the conflicting situation is displayed Visualizations to Support Interactive Goal Model Analysis - Horkoff, Yu
Visual Intervention: Conflict Highlighting Visualizations to Support Interactive Goal Model Analysis - Horkoff, Yu
Visualizations Applied • Five follow-up studies tested new visualizations • Participants were asked about the new interventions: • Do the leaves/roots highlighted in the model make sense? • Can you understand why there is a conflict? • Qualitative analysis of results (no statistical significance) • Several threats to validity described in paper Visualizations to Support Interactive Goal Model Analysis - Horkoff, Yu
Results • Leaf and Root Intention Highlighting: • A few roots and leaves were initially surprising, but upon examination the links became clear • Difference between global vs. local leaves and roots became apparent • Algorithm finds global leaves and roots • Participants often focused on local leaves and roots • -> Future improvements could highlight both types Visualizations to Support Interactive Goal Model Analysis - Horkoff, Yu
Results • Conflict Highlighting: • A considerable amount of knowledge of i* and the analysis procedure was needed to understand the causes of the conflict • Highlighting helped the study facilitators explain the conflicts to participants • -> i* analysis experience or the presence of an experienced facilitator is needed to gain the full benefits of interactive analysis • Similar conclusions as in the initial studies (PoEM’10) Visualizations to Support Interactive Goal Model Analysis - Horkoff, Yu
Conclusions and Future Work • Although goal model analysis can be helpful, comprehension difficulties exist • Applied two visual interventions to help alleviate these difficulties • Future work should look for additional visual enhancements for model analysis: • Highlighting areas needing human judgment (done) • Highlighting areas affected by changes in the model (in progress) • Future work could take an action research approach • Case studies in industrial settings Visualizations to Support Interactive Goal Model Analysis - Horkoff, Yu
Thank you • jenhork@cs.utoronto.ca • www.cs.utoronto.ca/~jenhork • yu@ischool.utoronto.ca • www.cs.utoronto.ca/~eric • OpenOME: • https://se.cs.toronto.edu/trac/ome Visualizations to Support Interactive Goal Model Analysis - Horkoff, Yu
Challenge: Where are the Conflicts? The following intention clauses are conflicting: not PS(Simple functionality) OR PD(Type checking for consistency) not PS(Flexibility) OR PD(Type checking and conversion) not PS(use inflo) OR PS(Graphing) not PS(Graphing) OR PS(Be inflo) not PS(Be inflo) OR PS(Create graphs) not PS(Type checking and conversion) OR PS(Node created automatically) not PS(Type checking and conversion) OR PS(Define types) not PD(Type checking and conversion) OR PD(Node created automatically) OR PD(Define types) not PS(Create graphs) OR PS(Dimensional analysis) not PS(Dimensional analysis) OR PS(Type checking for consistency) OR PS(Type checking and conversion) S(use inflo) PS(Usability for graph creation) not S(use inflo) OR PS(use inflo) not PD(Define types) OR not PS(Define types) not PD(Type checking for consistency) OR not PS(Type checking for consistency) not PD(Node created automatically) OR not PS(Node created automatically) not PS(Usability for graph creation) OR PS(Simplicity of inflo) not PS(Usability for graph creation) OR PS(Flexibility) not PS(Simplicity of inflo) OR PS(Simply functionality) Visualizations to Support Interactive Goal Model Analysis - Horkoff, Yu