Download
1 / 23
230 likes | 343 Views
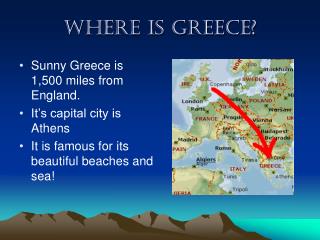
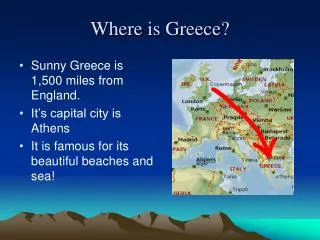
Peru – Greece Trade Opportunities. September , 2014. ¿Why invest in Peru?. Internationally acknowledged macroeconomic soundness. Friendly investment environment. Open trade and market access policy. 4. Attractive sectors to Invest. Peru is one of the most dynamic economies in the world.

E N D
Peru – GreeceTrade Opportunities September, 2014
¿Why invest in Peru? • Internationally acknowledged macroeconomic soundness Friendly investment environment Open trade and market access policy 4. Attractive sectors to Invest
Peru is one of the most dynamic economies in the world GDP constant prices * % change Source: IFM, WorldEconomic Outlook Database, Oct. 2013 * Estimated figures
Peru’s macroeconomic performance over the last decade has been exceptional Total Investment LA 6 2013 (% GDP) LATAM GDP Growth and inflation (2004 -2013) Uruguay Source: Central Bank of reserve of Peru, CRP, MEF, IMF – WEO Oct. 2013 LA6 : six Latin American countries that have adopted a formal inflation targeting framework and have relatively more developed domestic capital markets.
Peru offers a favorable legal framework for foreign investment Fuente: Proinversión *Investments that require authorization: Located within 50 km in the frontier line and those destined to arms, ammunitions and explosive. Likewise, a principal local partner for investments in maritime cabotage as well as in air transport is required.
In 2014, Peru is at the 42 position in the Doing Business Ranking Source: Doing Business 2014, World Bank. Analysis of 185 countries
Positive Outlook for Peruvian exports in the long term (U.S. $ million) Over the period 2007 - 2011 we doubled our exports Between 2000 and 2006, we tripled our exports 20 years for doubling exports Towards 2016 Peru will double its exports, triplicate non-traditional exports, and double the number of exporters Source: SUNAT
The Peruvian export success creates a dynamic effect on the rest of the national economy (2013) 4 660 Productsexported U.S.$ 1 370 Exports per capita 5 000 to 2016 U.S. $ 2 730 to 2016 8 133 Exporters US$ 10 981 M Non-TraditionalExports Source: SUNAT
Working to become a globalized economy, with preferential access to the world’s largest markets + 55 world economies + 2 500 millions of consumers + 95% of Peruvian exports with trade preferences Agreementssigned Agreements under negotiation Agreements in force
Enlargement of Trade Agreement Network US Millions Dollars Source: Sunat. Elaboration: Market Intelligence – PROMPERU
Greece is our 16th trading partner in Europe and the 62th in the world (2013) Commercial trade grew at with an average annual rate of 12,2% during the period 2009-2013 Source: Sunat. Elaboration: Market Intelligence – PROMPERU (*) 2014: January – June.
Imports from Greece grew at an average annual rate of 14,2% between 2009 and 2013 Top ImportedProducts 2013 Evolution of Peruvian imports from Grece (U.S. $ million FOB) • Jams, fruit jellies, marmalades, fruit puree and pastes of other fruits (US $ 4.1 million) • Printed books, brochures and similar printed matter (US$ 2.5 million) • Peaches Incl. nectarines, prepared or preserved, containing no spirits but with added sugar (US $ 1.1 million) • Artificial guts (Excl. those of hardened protein or cellulose materials)(US $ 0.7 million) • Marble, travertine and alabaster articles thereof, with a flat or even surface (US $ 0.6 million) Source: Sunat. Elaboration: Market Intelligence – PROMPERU (*) 2014: January – June.
Traditional exports from Peru to Greece increased by 14,4% between 2008 – 2013. Traditional Exports (US$ Millions FOB) Top Traditional Products 2013 • Fishmeal (US$ 9.1 millions ) • Copper (US$ 0.6 millions ) • Coffee (US$ 0.2 millions) Source: Sunat. Elaboration: Market Intelligence – PROMPERU Traditional exports were not registered in 2014 (Jan – Jun)
Non traditionalexportsfrom Peru to Greeceaccounted US$ 3 millions in 2013 Non Traditional Exports (US$ Millions FOB) Top Non Traditional Products2013 (US$ Thousands FOB) • Fungicide preparations based on copper compounds ( US$ 1 091) • Prepared or preserved Tuna (US$ 487) • Frozen Squid (US$ 297) • Dried, shelled cow peas, whether or not skinned or split(US$ 246) • Salts of inorganic acids or peroxoacids (US$ 124) • Copper sulfate(US$ 100) Source: Sunat. Elaboration: Market Intelligence – PROMPERU (*) 2014: January – June.
Between 2009 - 2013, tariffitemsexported to Greecedecreasedby 13,4% 2013: 37 ítems corresponded to Non Traditional Exports Source: Sunat. Elaboration: Market Intelligence – PROMPERU
33 Peruvian companies exported to Greece in 2013 2013: 26 companies corresponded to Non Traditional Exports Source: Sunat. Elaboration: Market Intelligence – PROMPERU
Trade Opportunities in Greece
Chemical Sector Top / Major export destinations – 2013 Peru: Indicators of thechemical sector in theGreekmarket - 2013 • US$ 1,6 millions (-1,6%) • 8 exporters • 9tariffitemsexported Source: Sunat. Elaboration Inteligencia de Mercados – PROMPERU 20
FisheryIndustry Main Destinations of Peruvian Fishery exports – 2013 Peru: Indicators of the Fishery Sector in the Greek market – 2013 • US$ 785 Thousands (+33%) • 5 export companies • 2 tariff items exported Source: Sunat. Elaboration: Market Intelligence – PROMPERU 21
Agribusiness Industry Main destinations of Peruvian agribusiness exports – 2013 Peru: Indicators of the Agribusiness Sector in the Greek market – 2013 • US$ 294 Thousands (-69,3%) • 7 export companies • 9 tariff items exported (+500%) Source: Sunat. Elaboration: Market Intelligence – PROMPERU 22
Peru – GreeceTrade Opportunities September, 2014