Download
1 / 38
380 likes | 486 Views
Temporal Abstractions for Interpreting Diabetic Patients Monitoring Data. Advisor : Dr. Hsu Graduate : Min-Hong Lin IDSL seminar 2002/1/30. Outline. Motivation Objective Background IDDM(Insulin Dependent Diabetes Mellitus) Temporal Abstractions

E N D
Temporal Abstractions for Interpreting Diabetic Patients Monitoring Data Advisor: Dr. Hsu Graduate:Min-Hong Lin IDSL seminar 2002/1/30
Outline • Motivation • Objective • Background • IDDM(Insulin Dependent Diabetes Mellitus) • Temporal Abstractions • TA for Interpreting Diabetic Patients Monitoring Data • A Case Study • Conclusions • Comments
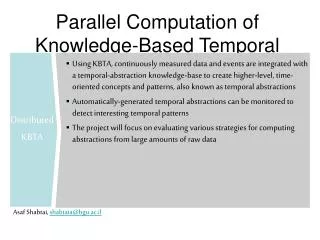
Motivation • Several medical domains require: • Analyzing and interpreting a large number of longitudinal data. • Data coming from long-term monitoring of chronic patients. • Physician must interpret information on the basis of a comprehensive analysis. • In the interpretation task, the data pre-processing phase is a crucial step.
Objective • To show that the data analysis and interpretation tasks can be carried out by transforming the raw data into a abstract view of the patient’s history. • Propose a novel approach based on the combination of a temporal abstraction method with statistical and probabilistic techniques. • Apply TA to the long-term monitoring of Insulin Dependent Diabetes Mellitus(IDDM) patients.
Insulin Dependent Diabetes Mellitus • Diabetes Mellitus is a major chronic disease in developed countries (about 3%). • Diabetes Mellitus is characterized by an alteration of the glucose metabolism due to a decreased endogenous production of insulin. • In IDDM the patients must take exogenous insulin in order to prevent extremely high blood glucose levels(hyperglycemia).
Insulin Dependent Diabetes Mellitus(cont’d) • The patients perform self-monitoring of the Blood Glucose Levels (BGL) and glycosuria at home, and report the monitoring and therapeutic data in a diary. • The accuracy of the patients’ self-care is very important, since the onset and development of diabetic complications is strictly related to the degree of metabolic control. • The physicians revise the therapy during periodical visits, every two/six months.
IT for Diabetes Care • To improve the quality of the therapy revision process and the patients’ management, several computer-based systems have been proposed since the early 80’s. • Different systems categories: • Day-by-day advisory systems V.S. visit-by visit advisory systems • Model-based systems V.S. Data-driven systems • Statistical analysis and graphical representations • Time-series analysis and temporal abstractions
Temporal Abstractions • TA is an AI methodology. • TAs are used in data interpretation to solve the temporal abstraction task whose goal is to abstract high level concepts from time-stamped data. • In the medical domain, TAs can be used to describe patients states holding over time periods. • The principle of the TA method is to move from a time-point to an completely interval-based representation of the monitoring data.
Temporal Abstractions(cont’d) • TA task is decomposed into two main type of TA subtasks: • Basic TA: solved by mechanisms that abstract time-stamped data into intervals(input data are events and outputs are episodes) • State TAs:detect episodes associated to qualitative levels of time-varying variables, like normal or abnormal states. • Trend TAs: detect patterns like increase, decrease and stationarity in a numerical time series. • Complex TA: solved by mechanism that abstract intervals into other intervals(input and output data are episodes)
Basic TA task • For each basic TA it defines two parameters: • Granularity: represents the maximum allowed temporal gap between two measurements that can be aggregated into the same episode. • Minimum extent: represents the minimum time span of an episode to be considered relevant.
Complex TA task • The mechanism solving the complex TA task searches for temporal relationships between episodes. • The temporal relationships investigated can be expressed through temporal operators defined in the Allen algebra(before, after, meets, overlaps, starts, finishes, equals, during)
An example of the complex TA task(cont’d) • If the input episodes refer to patterns extracted from different time series, the method can detect patterns in multi-dimensional data. • For example, the problem of investigating whether a persistent cough and high fever occur simultaneously in a patient’s history. PERSISTENT COUGH OVERLAPS HIGH FEVER
Temporal Abstraction for the Interpretation of Diabetic Patients’ Monitoring Data • Data Pre-Processing • Analyze the original time-series using TAs • Derive a collection of new time-series by computing the TAs that are true in each time point of the original time scale. • Data Interpretation
Data Pre-Processing • Subdivide the 24-hours daily period into a set of consecutive non-overlapping time slices • Perform the analysis on the time series of three variables ( BGL, glycosuria and insulin dosages)
Data Pre-Processing(cont’d) • Define a set of basic and complex abstractions for each time slice.
Data Pre-Processing(cont’d) • Characterize the patients’ behavior through the concept of Abstract State(ABST), that corresponds to the combination of the TAs that are true in that period. • The general form of the abstract state in the i-th day for the j-th time-slice(ABSTij) is:
Data Interpretation • The Blood Glucose Modal Day(BG-MD) • The Blood Glucose Modal Daily Pattern(BG-MDP) • Exploiting TA Time-Spans • Exploiting Complex TAs
The Blood Glucose Modal Day(BG-MD) • The BG-MD is a characteristic daily BGL pattern that summarizes the typical patient’s response to the therapy in a specific monitoring period • It is usually derived as the collection of the most probable blood glucose qualitative levels in each time slice. • K:states, N: monitoring days, D:collect measurements, M=N-D: missing data, dl is the number of occurrence of the l-th state in the monitoring period. • Ignorance (IG) in the monitoring period: • The modal day can be extracted by taking the BGL states with the highest pinfin each time slice.
The Blood Glucose Modal Daily Pattern(BG-MDP) • BG-MDP is the most frequent sequence of abstract states of the BGL variable in the different time slices of one day. • Search parameters: the maximum allowed ignorance (MIG) in one time slice (I.e. the maximum number of allowed missing data) and the minimum probability bound for the joint probability distribution Pinf. • Time slices selection: only the time slices that have ignorance level lower than MIG will include in the BG-MDP • Search: perform an exhaustive search of the daily patterns that have a lower probability bound higher than Pinf.
Exploiting TA Time-Spans • If the time span of the BGL normoglycemic episodes have an exponential distribution, it is clear that the patient is not able to control his/her glucose metabolism for a long period. • Perform a non-linear least-squares fitting of the model • Once we have estimated λ, we test the hypothesis that the data follows an exponential law with parameter through the x2 statistics. • The exponential distribution hypothesis is rejected with degree α if x2h-1 > x2h-1(1- α)
Exploiting Complex TAs • In clinical practice, the physician usually tries to combine the information coming from the different variables under monitoring. • Somogyi effect : is detected by looking for “hyperglycemia at Breakfast with absence of glycosuria” • Dawn effect : is detected by searching for “hyperglycemia at Breakfast with presence of glycosuria” • Metabolic Instability : in which a “BGL increase” is immediately followed by a “BGL decrease ” or vice-versa.
A Case Study • A 14 years-old female patient, monitored for a period of 165 days. The BGL data are show below:
Conclusions • TA method requires an intensive knowledge acquisition effort for the TA definition, both in terms of types of TAs to be applied to the particular problem and in terms of the parameters that some TAs require. • TA method will enable the assessment of a new class of data mining systems.
Comments • How to prevent from diabetic: • Diet • Physical exercise • Check the BGL regularly