Download
1 / 27
270 likes | 398 Views
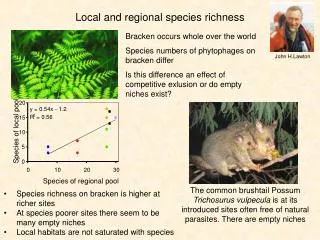
Changes in Species Richness with Elevation. By: Jeff Bell , Daniel Burke, Emily Carter, Andrew Cutler, and Liam Shae. Bay of Fundy. -Contours of bay increase tide fluctuation. -Diverse coasts supporting different ecosystems. srh.noaa.gov. Intertidal Zonation.

E N D
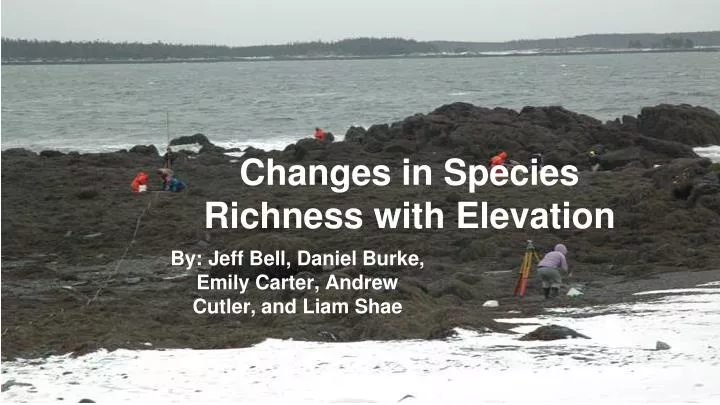
Changes in Species Richness with Elevation By: Jeff Bell, Daniel Burke, Emily Carter, Andrew Cutler, and Liam Shae
Bay of Fundy -Contours of bay increase tide fluctuation. -Diverse coasts supporting different ecosystems. srh.noaa.gov
Intertidal Zonation -Biota exist in horizontal bands related to tides. -Organisms’ upper limit set by physical factors and lower set by biological factors. -Intertidal divided into zones. (Raffaelli and Hawkins, 1996)
Size of Intertidal and its Subzones -Steep sloping coasts will have smaller intertidal zones than gently sloping coasts. -Zones can increase with increasing wave exposure. novascotiatravel.ca meted.ucar.edu
Wave Action + Slope Affect Substrate -Steep slope + high wave action= cobble and boulder. -Gentle slope + low wave action= gravel, sand and/or mud. -Substrate profile will influence community structure. clark.edu srh.noaa.gov
Experiment In this study, the change in intertidal invertebrate community structure with changing elevation at 3 sites along the coast of the Passamaquoddy Bay were examined. saveourbay.ca
Hypotheses • Community structure and diversity will change with elevation. • Steeper slopes will have greater community variation. • Higher elevations will have lower diversity.
Methods • Data was collected at three locations: • Indian Point • Green’s Point • Bar Road • January 24th-26th, 2014.
Elevation • 100m transect, perpendicular to shore • Levelling scope • Levelling rod (Imperial measurement) • Every 2m
Community Structure & Diversity • Quadrats every 10 m. • Invertebrate species recorded & identified. Quadrate Picutre
Statistical Analyses • OLS regression was used to test the relationship between elevation and species richness (SR). • Sorenson’s : QS=2C/S1+S2 • Comparison of diversity between sites.
Bar Road Jan 26th, 2014 Low Tide: 14:47 Time Sampled: 14:47 Jan 25th, 2014 Low Tide: 13:47 Time Sampled: 13:30 Jan 24th, 2014 Low Tide: 12:48 Time Sampled:12:48 Greens Point Indian Point
Discussion: Change in Elevation Bar Road • Increasing trend • Maximum elevation 264cm at 80m • No samples between 100-150cm • Green’s Point • Decreasing trend • Minimum elevation -337cm at 100m
Indian Point • No trend • Max: of 30cm • Min: -47cm
Vertical Tide • Date, time, height (FOC) • 5-6m change in height • Much larger than our greatest elevation
Species Richness vs. Elevation • Variability in SR values • Range 0-8 • Regression (m=0.0014, r2= 0.0108) • Did not support our hypotheses
Scrosati & Heaven (2007) • Menge & Sutherland’s Environmental Stress Model (1987) • Gulf of St. Lawrence • Higher elevations show lower species richness
Indian Point - Indian Point was the most species rich site of the three - 14 species present, 1 more than Greens Point - High diversity due to the mix of medium wave-action and a diverse range of substrate sizes, and high seaweed cover -Combination of these factors could make Indian Point the most hospitable site to the greatest number of species
Bar Road - 8 species catalogued, fewest of three sites -Calmest, most sheltered, least disturbed site - Mainly fine, sedimentary substrate - Those species present are under reduced stress from wave/storm action allowing them to outcompete others in their niche
Green’s Point - Second most diverse with 13 species - High wave-action, rocky substrate, exposed - Forces of extreme abiotic factors prevents any one species from dominating = increased diversity - Rocky substrates provides shelter for some species from predators/competitors/desiccation - High wave-action increases size of intertidal area, spreading moisture further
Potential Error - Species were catalogued dead or alive; living specimens firmly in place, dead ones moved, deposited in areas where they would not normally be. Ex. Mytilus edulis would be expected at Green’s Point, but not Bar Road, but it was. - Overall counts were not taken due to time constraints; would have helped highlight what was normally present and what had been placed there
- Sampling performed at different times in tidal cycle between sites - Short 3-day sampling period, results tainted by the “learning period” - Bay of Fundy tidal fluctuations are huge, 100 metre transect may have been insufficient to reach from zone to zone, explain lack of shift in species diversity