Download
1 / 32
320 likes | 416 Views
Modeling the behavioral determinants of travel behavior: an application of latent transition analysis. Maarten Kroesen Section Transport and Logistics (TLO). Transportation: a mixed blessing. Sustainable mobility. Two types of questions.

E N D
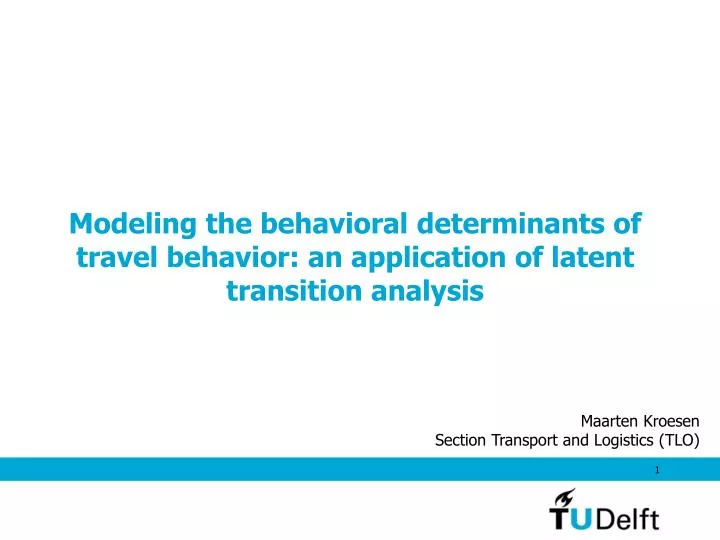
Modeling the behavioral determinants of travel behavior: an application of latent transition analysis Maarten Kroesen Section Transport and Logistics (TLO)
Two types of questions • What determines people’s mode choice? (cost, travel time, flexibility, income, attitudes) • What are the patterns of substitution / complementarity between modes? If better PT generates travel (instead of substituting car travel) better PT is of little use…
What are the patterns of substitution / complementarity between modes? Golob, T. F. and Meurs, H. (1987) A structural model of temporal change in multi-modal travel demand. Transportation Research Part A: Policy and Practice, 21, 391-400. Year1 Year2 Caruse Caruse e Bicycle use Bicycle use e Public transport use Public transport use e
What are the patterns of substitution / complementarity between modes? Golob, T. F. and Meurs, H. (1987) A structural model of temporal change in multi-modal travel demand. Transportation Research Part A: Policy and Practice, 21, 391-400. Year1 Year2 Caruse Caruse ++ • Insights: • Travel behavior is generally inert e Bicycle use Bicycle use ++ e Public transport use Public transport use ++ e
What are the patterns of substitution / complementarity between modes? Golob, T. F. and Meurs, H. (1987) A structural model of temporal change in multi-modal travel demand. Transportation Research Part A: Policy and Practice, 21, 391-400. Year1 Year2 Caruse Caruse ++ • Insights: • Travel behavior is generally inert • Car demand is affected by bicycle demand, but not by PT demand e - Bicycle use Bicycle use ++ e Public transport use Public transport use ++ e
What are the patterns of substitution / complementarity between modes? Golob, T. F. and Meurs, H. (1987) A structural model of temporal change in multi-modal travel demand. Transportation Research Part A: Policy and Practice, 21, 391-400. Year1 Year2 Caruse Caruse ++ • Insights: • Travel behavior is generally inert • Car demand is affected by bicycle demand, but not by PT demand • Bicycle demand is affected by car and PT demand e - - Bicycle use Bicycle use ++ e - Public transport use Public transport use ++ e
What are the patterns of substitution / complementarity between modes? Golob, T. F. and Meurs, H. (1987) A structural model of temporal change in multi-modal travel demand. Transportation Research Part A: Policy and Practice, 21, 391-400. Year1 Year2 Caruse Caruse ++ • Insights: • Travel behavior is generally inert • Car demand is affected by bicycle demand, but not by PT demand • Bicycle demand is affected by car and PT demand • PT demand is not affected by car or bicycle demand e - - Bicycle use Bicycle use ++ e - Public transport use Public transport use ++ e
What are the patterns of substitution / complementarity between modes? Golob, T. F. and Meurs, H. (1987) A structural model of temporal change in multi-modal travel demand. Transportation Research Part A: Policy and Practice, 21, 391-400. Year1 Year2 Caruse Caruse ++ • Questions: • No direct effect between PT and car use, but maybe cycling aids in the transition from car to PT? • Which kind of transitions can be identified? • Which travel patterns can be identified? • What is the influence of external conditions/events on transition behavior (e.g. sex, age, moving house)? e - - Bicycle use Bicycle use ++ e - Public transport use Public transport use ++ e
An alternative conceptualization Matrix of transition probabilities Year1 Year2 Caruse Caruse e e Travel behaviorpatterns Travel behaviorpatterns Bicycle use Bicycle use e e Public transport use Public transport use e e Sex Age Moved house LCM LCM Latent transition model
Data • The Dutch mobility panel • 10 bi-annual waves (March and September) from 1984 to 1989 • 3500-4000 individuals per wave • Analysis was based on 6 March waves • Data were pooled into 2 waves • N=5,314
Distributions (N=5,314) Count variables integer and positive Trips by car Trips by bicycle Trips by PT
Latent class model Year1 Caruse e 0 Travel behaviorpatterns Bicycle use 0 e 0 Count data assume that LC represents a mixture of Poisson distributions (i.e. each class is associated with a different Poisson mean for each indicator), such that the associations between the residuals equal 0 (assumption of conditional independence, similar to FA) Public transport use e LCM
Finding the optimal number of classes <3.84 n.s.
Latent class model with covariates Year1 Caruse e Travel behaviorpatterns Bicycle use Multinomial logit (MNL) model e Public transport use e Sex Age Moved house LCM
Latent transition model with covariates Year1 Year2 Caruse Caruse e e MNL model Travel behaviorpatterns Travel behaviorpatterns Bicycle use Bicycle use e e Public transport use Public transport use e e Sex Age Moved house
Matrix of transition probabilities Single mode users more inert than multi-modal users
Matrix of transition probabilities Very few transition between single-modal user patterns, the joint car+bicycle patterns acts as an intermediate step
Matrix of transition probabilities Strict car users have the same probability of moving towards the PT profile as joint car+bicycle users
Matrix of transition probabilities However, there is relatively much movement between the PT profile and the strict bicycle profile
Matrix of transition probabilities This is for the sample as a whole, but that are significant interactions! Solution: compute matrix for different subgroups
Old men who did not move house Young women who did move house
Conclusions • People’s travel behavior can be condensed into five clusters. • The clusters point to different patterns of complementarity and substitution between the modes. • The research shows that multimodal users are more likely to switch than single-mode users. • Younger people are generally less inert than older people • People’s travel behavior becomes more in flux after a move • For younger people it holds that the bicycle may aid in the transition from a car to PT profile.
Reflection and future research • LTA modeling requires (very) large sample sizes • Data in this study are old (25 years) • Explore influence of built environment / level of service • Explore influence of other life events (children, divorce, death of a family member, job change) • Explore influence of attitudes / lifestyle • Explore two-way interactions