Download
1 / 15
150 likes | 240 Views
Fleur A. D. Leenen, Oliver Hunewald, Sara Vernocchi , Stephanie Schmitz, Regina Brunnhöfer , Anne Molitor, Jonathan D. Turner and Claude P. Muller. Transcription microvariability detection by NGS. Institute of Immunology Centre de Recherche Public-Santé National Public Health Laboratory

E N D
Fleur A. D. Leenen, Oliver Hunewald, Sara Vernocchi, Stephanie Schmitz, Regina Brunnhöfer, Anne Molitor, Jonathan D. Turner and Claude P. Muller Transcription microvariability detection by NGS Institute of Immunology Centre de Recherche Public-Santé National Public Health Laboratory Luxembourg
Hypothalamic-pituitary-adrenalaxis • HPA-axis • reactions to stress • many physiological processes • Glucocorticoids • Nervous & Immune system • Learning and memory • Stress response • … • Glucocorticoid receptor (GR) • Negative feedback HPA axis • Ubiquitous presence • Expression levels vary • Complicated Structure
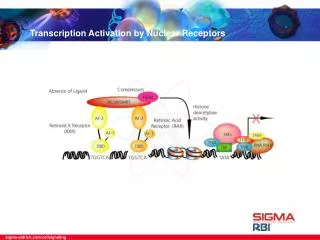
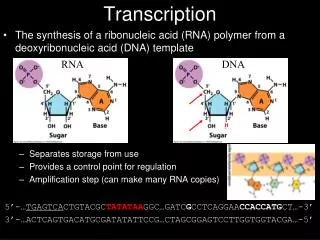
The NR3C1 gene A. • human GR gene • 10 exons • 9 translated exons • 9 alternative 1st exons • All 5’UTR • Removed after splicing • ATG translation start in exon 2 • Translational regulation • CpG island • Methylation • Environmental influence on expression B. Turner et al.,BiochemPharmacol 2010 Cao-Lei et al., Hum Genet 2011
1-B 1-C3 1-C2 1-Ctotal 1-D 1-E 1-F 1-H GRtotal b-actin Tissue specific expression • Variable expression • Hippocampus expresses all the exons and splice variants • 1-B, 1-C and 1-H are the most widely expressed • 1-D only in the hippocampus • Complex 5’ UTR involved in the regulation of the GR transcription Turner and Muller, JMol Endo 2005
5’RACE adapted to NGS Daudi Tot. RNA extraction Multiple CellLines Cell Line + Stimulus A549 100nM Dex Exon 2 Exon 1x T cells Exon 1x Exon 1x Exon 1x Exon 2 Exon 2 Exon 2 100U IFNγ 1. Dephosphorylation MCF-7 10μM AZA Oligo 2. Cap removal 3. Ligation RNA oligo Turner et al.,BiochemPharmacol 2010 Oligo 4. Gene specific RT 5. 1st round PCR 6. Nested PCR Shearing • Library preparation • Emulsion PCR Region of Interest: 27kb Coverage: 20x Theoretical read number: 540000 Practical read number: 250000 NGS Sequencing (PGM Ion Torrent, life technologies)
Data Analysis NGS data Oligo Exon 1x Exon 2 • Read Selection • Remove ligated oligo sequence • Mapping & TSS position retrieval (TopHat + own script) • SelectedTSSs • Occurrence / Frequency • Normalisation • (TMM) • Selected TSS’s per Cell Line and Conditions • SequenceFrequencies per TSS • SharedTSS’s • Differentially expressed TSS’s • Use of existing Software packages (NOISeq) • Instead of gene, TSS as entity • Between 2 Cell Lines or Conditions • ± 25 most important TSS’s • for differentiation between Cell Lines/Conditions
Technical Confirmation A. C. • Control Gene: ADRB2R only 1 exon • Highly reproducible • Identical TSS selection B. 99.82% 99.75% 99.83%
Multiple Cell Lines: Reproducibility – A549 78.59% A. B. 78.08% 17.42% 0.82% Seq/TSS TSS’s of A549 Replicate 2 78.59% 17.26% 17.26% 17.42% TSS’s of A549 Replicate 1 0.54% Seq/TSS 0.64% Seq/TSS 78.07% 0.81% Seq/TSS Proximal Promoter: 1D, 1J, 1E, 1B, 1F and 1C
Multiple Cell Lines: Shared, but DE TSSs A. C. B. MCF-7 Tcells Daudi MCF7 A549 A549
TSS Variability is Reduced on Stimulation • Daudi: High Variability 34.30% Frequency (%) 62.88% 27.02% 71.81% TSS’s
TSS Variability is Reduced on Stimulation - Dex 11.49% 84.99% 86.44% A. B. 1.03% Seq/TSS 86.44% TSS’s of Dex Replicate 2 11.05% 11.05% 11.49% TSS’s of Dex Replicate 1 0.82% Seq/TSS 0.53% Seq/TSS • Daudi+ Stimuli • Dexamethasone • 5-aza-2’ deoxycytidine • Interferon-Ɣ • Reproducible Variability • Altered TSS’s selection 84.99 1.01% Seq/TSS
TSS variability is Reduced on Stimulation A. C. B. C. Daudi Daudi AZA10 IFN Dex Dex
Conclusion • Majority Reads • Majority alternative 1st exons Proximal Promoter CpG island transcription factors can bind at different positions within such a promoter site. The selection of TSS’s varies according to external influences.
Acknowledgments LNSI, CRP-Santé, Luxembourg: Claude P. Muller Jonathan D. Turner Sara Vernocchi Oliver Hunewald Steffi Schmitz Regina Brunnhöfer Anne Molitor Funding:
Analysis Technique: Manual - TopHat A. B. • Control Gene: ADRB2R • 2 approaches: Manually TopHat • Similar Results