Download

1 / 20
200 likes | 306 Views
Analyzing Field Notes Systematically to Better Understand Respondent Participation in the National Health Interview Survey, 2002-2007. Barbara Stussman and Catherine Simile National Center for Health Statistics. Textual Data About the Data Collection Process in the NHIS.

E N D
Analyzing Field Notes Systematically to Better Understand Respondent Participation in the National Health Interview Survey, 2002-2007 Barbara Stussman and Catherine Simile National Center for Health Statistics
Textual Data About the Data Collection Process in the NHIS • Collected on a variety of topics • Current Research: • Reasons for incomplete interviews • Reasons for conducting interviews over telephone
Research Goals • To better understand field situations in the NHIS • To improve the efficiency of data analysis on variables related to the interviewing process • To make more data available for paradata file
2007 NHIS Modules • Household 29,266 • Family 29,915 • Sample Adult 23,393 • Sample Child 9,417
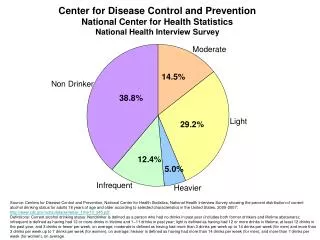
NHIS Modules (Cont.) • Sample adult is self-reported • Supplemental modules added on yearly basis creating a longer interview • In 40% of cases, there are two or more respondents • Primarily a face-to-face survey
How Much Textual Data for Our Research Topics? • Reasons for Incomplete Interviews: • Produced textual data when precoded categories didn’t fit • About 2000 cases in 2002 • Reasons for Conducting by Telephone: • All cases produced textual data • About 10,000 cases in 2005
Analysis Steps 1. Analyze original questions 2. Redesign questions 3. Field newly designed questions 4. Begins process again with analysis of newly designed questions
Analysis of 2002 Incomplete Interviews • Break-off vs. Partial (stopped in progress vs. need more info. later) • Design problems • Could not differentiate between reasons for partials and reasons for break-offs • Could not tell in what section the partial or break-off occurred • Pre-coded categories insufficient
2002 Incomplete Interviews:Results of Textual Data Analysis • Reasons captured in 2002 pre-coded categories: • No one home, repeated calls • Language problem • Too personal • Too long • No time • Respondent sick • No reason • Other: Specify
Results of 2002 Analysis of Textual Data, cont. • New categories that emerged: • Respondent had to leave (break-off only) • Respondent does not like/trust government • Respondent’s relative (spouse/child) did not want her/him to participate • Computer error
Design Changes Made for 2004 • 2 paths : one for partials & one for break-offs • Added question to determine in which section the partial or break-off occurred • Added more categories to reduce other specify
Analysis of 2007 Data on Incomplete Interviews • Break-offs versus Partials: • 48% Break-off vs. 52% Partial • Which section break-off occurred: • 70% Sample Adult, 16% Sample Child 10% Family, 5% Household Comp. • Which section(s) were incomplete (Partial): • 94% Sample Adult, 16% Sample Child 6% Family, 5% Household Comp.
Analysis of 2007 Textual Data on Incomplete Interviews • Number of textual entries recorded in other specify category: • 2,065 in 2002 vs. 827 in 2007 • Questions we still have: • Are we still not capturing some reasons in our pre-coded categories? • Do we gain or lose information for these cases?
Outcome of Backcoding 2007 Textual Data on Break-offs • Entry can be backcoded (51%) • Gain Information if backcoded (28%) • Lose Information if backcoded (18%) • No gain or loss (5%) • Combination (2%) • Entry does not fit into existing categories (49%) • New category needed (35%) • Should have been coded as Partial (15%)
Analysis of 2005 NHIS: Reasons for Using the Telephone • Were any [main sections] conducted primarily by telephone? • Which ones • Specify why a telephone interview was conducted. • Two 5 percent samples from 10,461 entries using systematic sampling with a random start. (1,043 entries)
Analysis of 2005 Textual Data: Reasons for Conducting Interviews by Telephone • Main Findings: • R. requested (no more info.) (42%) • Only way to reach R. (17%) • R. did not want interviewer in their house (8%) • R. called and wanted to do interview then (8%)
Enter the reason (s) one or more main sections were conducted primarily by telephone. 1. Only way to reach respondent (29%) 2. Respondent did not want FR in home (10%) 3. Respondent too busy for home interview (31%) 4. Follow-up/Reassigned case (4%) 5. Distance (Respondent out of town or too far away from FR) (4%) 6. Respondent or family member ill (3%) 7. Near closeout (4%) 8. Language barrier (0%) 9. Other (specify) (15%)
Analysis: 2008 Quarter 1 Textual Data on Use of Telephone (N=303) • Matched existing category (23%) • Categories that emerged: • Respondent requested (no reason given)(32%) • Respondent called & wanted to do interview right then (17%) • More convenient for interviewer (9%) • Only way R. would do interview (8%) • Bad weather (5%) • Other (6%)
Conclusions • Insight into field situations: • Obtaining additional respondent factor in incomplete interviews • Interviews see clear distinctions between categories • Some interviewers may have tendency to use open-ended category even when pre-coded fits
Conclusions, cont. • Increasing efficiency of data collection: • Pre-coded categories more efficient to analyze • Able to release pre-coded categories to the public