Download
1 / 44
550 likes | 979 Views
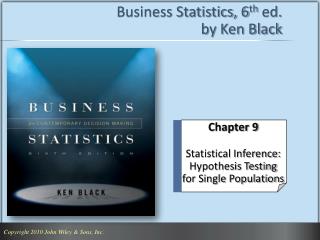
Business Statistics, 6 th ed. by Ken Black. Chapter 9 Testing Hypotheses about Single Population Parameters. Learning Objectives. Understand the logic of hypothesis testing, and know how to establish null and alternate hypotheses.

E N D
Business Statistics, 6th ed.by Ken Black Chapter 9 Testing Hypotheses about Single Population Parameters
Learning Objectives • Understand the logic of hypothesis testing, and know how to establish null and alternate hypotheses. • Understand Type I and Type II errors, and know how to solve for Type II errors. • Know how to implement the Hypothesis, Test, Action, Business (HTAB) system to test hypotheses. • Test hypotheses about a single population mean when s is known. • Test hypotheses about a single population mean when s is unknown. • Test hypotheses about a single population proportion. • Test hypotheses about a single population variance.
Introduction to Hypothesis Testing • Hypothesis Testing – researchers are able to structure problems in such a way that the researcher can use statistical evidence to test various theories about phenomena
Types of Hypotheses • 1. Research Hypothesis • a statement of what the researcher believes will be the outcome of an experiment or a study. • 2. Statistical Hypotheses • a more formal structure derived from the research hypothesis. • Composed of two parts • Null hypothesis (Ho) – null hypothesis exists;old statement is correct • Alternative (Ha) – the new theory is true
Types of Hypotheses • 3. Substantive Hypotheses - a statistically significant difference does not imply or mean a material,substantive difference. • If the null hypothesis is rejected and the alternative hypothesis is accepted, then one can say that a statistically significant result has been obtained • With “significant” results, you reject the null hypothesis
Statistical Hypotheses • Two Parts • a null hypothesis - nothing new is happening; the null condition exists • an alternative hypothesis - something new is happening • Notation • null: H0 • alternative: Ha
Null and Alternative Hypotheses • The Null and Alternative Hypotheses are mutually exclusive. • Only one of them can be true. • The Null and Alternative Hypotheses are collectively exhaustive. • The Null Hypothesis is assumed to be true. • The burden of proof falls on the Alternative Hypothesis.
Null and Alternative Hypotheses: Example • A manufacturer is filling 40 oz. packages with flour. • The company wants the package contents to average 40 ounces.
One-tailed and Two-tailed Tests • One-tailed Tests • Two-tailed Test
8 Steps in Testing Hypotheses 1. Establish hypotheses: state the null and alternative hypotheses. 2. Determine the appropriate statistical test and sampling distribution. 3. Specify the Type I error rate ( 4. State the decision rule. 5. Gather sample data. 6. Calculate the value of the test statistic. 7. State the statistical conclusion. 8. Make a managerial decision.
Rejection and Nonrejection Regions • Conceptually and graphically, statistical outcomes that result in the rejection of the null hypothesis lie in what is termed the rejection region. • Statistical outcomes that fail to result in the rejection of the null hypothesis lie in what is termed the nonrejection region.
Rejection and Non Rejection Regions • Possible statistical outcomes • Reject null hypothesis – results lie in this area • Do not reject hypothesis – stat results fail to reject the null hypothesis • ***If values fall in “rejection region” you reject the null hypothesis • DRAW THE REJECTION AND NON-REJECTION GRAPH
Rejection Region Rejection Region Non Rejection Region =40 oz Critical Value Critical Value Rejection and Non Rejection Regions
Type I and Type II Errors • Type I Error • Committed by rejecting a true null hypothesis • If the null hypothesis is true, any mean that falls in a rejection region will be a type I error • The probability of committing a Type I error is called ,the level of significance.
Type I and Type II Errors • Type II Error • Committed when a researcher fails to reject a false null hypothesis • The probability of committing a Type II error is called .
Null True Null False Fail to Correct Type II error reject null Decision ( ) Reject null Type I error Correct Decision ( ) Decision Table for Hypothesis Testing
Rejection Region Rejection Region Non Rejection Region Non Rejection Region =40 oz =40 oz Critical Value Critical Value One-tailed Tests
Rejection Region Rejection Region Non Rejection Region =12 oz Critical Values Two-tailed Tests
Testing Hypothesis about a Population Mean Using z Statistic (σ) • The z formula can be used to test hypothesis abouta single population mean if the sample size (n) is > 30 for any population, and < 30 if x is normally distributed
Testing Hypotheses about a Population Mean Using the z Statistic ( Known) • Example: A survey, done 10 years ago, of CPAs in the U.S. found that their average salary was $74,914. An accounting researcher would like to test whether this average has changed over the years. A sample of 112 CPAs produced a mean salary of $78,695. Assume that the population standard deviation of salaries = $14,530.
Testing Hypotheses about a PopulationMean Using the z Statistic ( Known) • Step 1: Hypothesize • Step 2: Test
Testing Hypotheses about a PopulationMean Using the z Statistic ( Known) • Step 3: Specify the Type I error rate- • = 0.05 z/2 = 1.96 • Step 4: Establish the decision rule- • Reject H0 if the test statistic < -1.96 or it thetest statistic > 1.96.
Testing Hypotheses about a PopulationMean Using the z Statistic ( Known) • Step 5: Gather sample data- • x-bar = $78,695, n = 112, = $14,530,hypothesized = $74,914. • Step 6: Compute the test statistic.
Testing Hypotheses about a PopulationMean Using the z Statistic ( Known) • Step 7: Reach a statistical conclusion- • Since z = 2.75 > 1.96, reject H0. • Step 8: Business decision- • Statistically, the researcher has enough evidenceto reject the figure of $74,914 as the true average salary for CPAs. In addition, based on the evidence gathered, it may suggest that the average has increased over the 10-year period.
Rejection Region Rejection Region Non Rejection Region 72,223 77,605 =0 CPA Net Income Example:Critical Value Method (Part 1)
Using p value to Test Hypothesis • P value – another way to reach statistical conclusion in hypothesis testing • No preset value of α is given in the p value method • p value defines the smallest value ofα for which the null hypothesis can be ejected • p-value < reject H0 • p-value do not reject H0
Using p value to Test Hypothesis • For two tailed test, alpha is split to determine the critical value of the test statistic • With the p value, the probability of getting a test statistic at least as extreme as the observed value is computed • The p value is then compared z or α/2 for two tailed tests to determine statistical significance
Using the p-Value to Test Hypotheses • One should be careful when using p-values from statistical software outputs. • Both MINITAB and EXCEL report the actual p-values for hypothesis tests. • MINITAB doubles the p-value for a two-tailed test so you can compare with . • EXCEL does not double the p-value for a two-tailed test. So when using the p-value from EXCEL, you may multiply the value by 2 and then compare with .
Critical Value Method to Test Hypotheses • The critical value method determines the critical mean value required for z to be in the rejection region and uses it to test the hypotheses.
Critical Value Method to Test Hypotheses • For the previous example,
Critical Value Method to Test Hypotheses • Thus, a sample mean greater than $77,605 or less than $72,223 will result in the rejection of the null hypothesis. • The test statistic for this test is
Testing Hypotheses About a Variance: Demonstration Problem 9.4 A small business has 37 employees. Because of the uncertain demand for its product, the company usually pays overtimeon any given week. The company assumed that about 50 total hours of overtime per week is required and that the varianceon this figure is about 25. Company officials want to know whether the variance of overtime hours has changed. Givenhere is a sample of 16 weeks of overtime data (in hours per week). Assume hours of overtime are normally distributed.Use these data to test the null hypothesis that the varianceof overtime data is 25. Let 57 56 52 44 46 53 44 44 48 51 55 48 63 53 51 50
Testing Hypotheses About a Variance: Demonstration Problem 9.4 • Step 1: • Step 2: Test statistic H0: 2 = 25 Ha: 2 25
Testing Hypotheses About a Variance: Demonstration Problem 9.4 • Step 3: Because this is a two-tailed test, = 0.10 and /2 = 0.05. • Step 4: The degrees of freedom are 16 – 1 = 15.The two critical chi-square values are 2(1 – 0.05), 15 = 2 0.95, 15 = 7.26093 and 2 0.05, 15 = 24.9958. • Step 5: The data are listed in the text. • Step 6: The sample variance is s2 = 28.1.The observed chi-square value is calculated as2 = 16.86.
Testing Hypotheses About a Variance: Demonstration Problem 9.4 • Step 7: The observed chi-square value is in the nonrejection region because 2 0.95, 15 = 7.26093< 2observed = 16.86 < 2 0.05), 15 = 24.9958. • Step 8: This result indicates to the company managers that the variance of weekly overtimehours is about what they expected.
Solving for Type II Errors • When the null hypothesis is not rejected, then either a correct decision is made or an incorrect decision is made. • If an incorrect decision is made, that is, if the null hypothesis is not rejected when it is false, then a Type II, , error has occurred.
Solving for Type II Errors (Soft Drink) • Suppose a test is conducted on the following hypotheses: H0: = 12 ounces vs. Ha: < 12 ounces when the sample size is 60 with mean of 11.985. • The first step in determining the probability of a Type II error is to calculate a critical value for the sample mean (in this case). • For an =0.05, then the critical value for the sample mean is (given on next slide).
Solving for Type II Errors (Soft Drink) In testing the null hypothesis by the critical value method, this value is used as the cutoff for the nonrejection region. For any sample mean obtained that is less than 11.979, the null hypothesis is rejected. Any sample mean greater than 11.979, the null hypothesis is not rejected.
Solving for Type II Errors (Soft Drink) • Since a Type II error, , varies with possible values of the alternative parameter, then for an alternative mean of 11.99 (< 12) the corresponding z-value is
Solving for Type II Errors (Soft Drink) • The value of z yields an area of 0.3023. • The probability of committing a Type II error isequal to the area to the right of the critical valueof the sample mean of 11.979. • This area is = 0.3023 + 0.5000 = 0.8023. • Thus, there is an 80.23% chance of committing aType II error if the alternative mean is 11.99. • Note: equivalent problems can be solved for sample proportions (See Demonstration Problem 9.6).
Operating Characteristic and Power Curve • Because the probability of committing a Type II error changes for each different value of the alternative parameter, it is best to examine a series of possible alternative values. • The power of a test is the probability of rejecting the null hypothesis when it is false. • Power = 1 - .