Download
1 / 7
70 likes | 209 Views
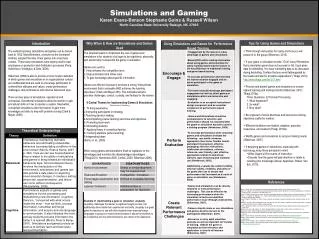
Scenarios and Simulations. Overview. Calibration Model vs Simulation Model Terms Using the Web Interface, Excel and GAMS to do simulations work Interpreting results Improving the model . Terms.

E N D
Overview • Calibration Model vs Simulation Model • Terms • Using the Web Interface, Excel and GAMS to do simulations work • Interpreting results • Improving the model
Terms • Base year: the year for which you have data; when the model solves in this year, it should EXACTLY replicate this data (2005) • Calibration solution: the solution for the projection period (currently IMPACT is 45 years); starts with the base year data and uses the projection input data that has been agreed upon by modeling team • Simulation: a solution for the projection period that uses the Baseline solution as a STARTING POINT, but allows for changes in the projection input data • Drivers: the exogenous projection input data that can be changed for simulation experiments • Income, Population, CC effects on yields over time, CC effects on area over time • Degree: the characteristic of the driver that makes it unique • Population and GDP: Shared Socioeconomic Pathways (SSPs) • Climate change: Hadgem, IPSL, etc.
Simulation Characteristics • Each simulation will have characteristics that you can specify • For each driver, only degree can be specified
Interpreting Results • Given the change in projection assumptions do your results make “economic” sense compared to the baseline solution? • Check world prices, trade, and supply • Are the world’s biggest suppliers/consumers still the biggest suppliers/consumers? • If not, is there a plausible “economic” reason for it? • What does trade look like for US, China, India, Brazil, etc.? • What do other long term projecting models say with a similar question? • Can the higher prices under a simulation with more production be explained by income growth? • Have your changes to intrinsic productivity growth rates and area growth rates created an unrealistic future? • Are the input projections from the simulation going to become the new baseline solution projections? • Do price projections follow historical patterns? • Do your projections tell a story? • Filter and graph your results
Comparisons of simulation results • When comparing simulation results, consider what is different between each simulation? • Are you comparing population changes? • Are you comparing climate effects? • If you are comparing population only, hold all the other drivers constant • Keep track of the drivers and degrees