Download
1 / 15
150 likes | 297 Views
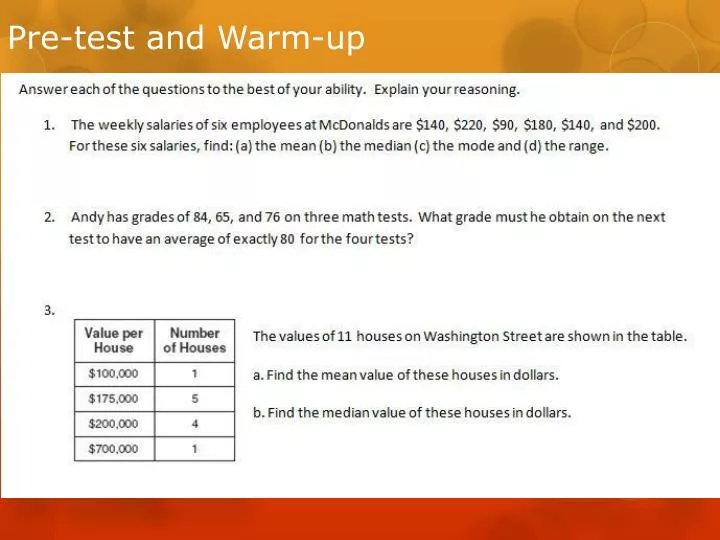
Pre-test and Warm-up. 6.7 `Measures of central tendency Mean or average of a numerical set of data is where you add all the numbers together and divide by the total number. Mean is often referred to as “x-bar” and the symbol looks like .

E N D
6.7 `Measures of central tendency Mean or average of a numerical set of data is where you add all the numbers together and divide by the total number. Mean is often referred to as “x-bar” and the symbol looks like . Median of a numerical set of date is the middle number when the values are in order from least to greatest. If there are 2 middle numbers then you average the 2 to find the median. Mode of a numerical set of data is the value that occurs the most often. Range of a numerical set of data is the Greatest number minus the smallest number. Example: Find the mean, median, mode, and range of the following data set. 65, 68, 71, 77, 81, 82, 86, 88, 93, 93, 95, 97 Mean: 83 Median: 84 Mode: 93 Range: 32
Practice At East Hall high school for physical fitness week all the ninth graders height was measured in inches and written down. The following lists are for the ninth grade boys and the ninth grade girls. Boys: 59, 60, 61, 61, 62, 63, 63, 65, 66, 66, 66, 67, 68, 70, 72 Girls: 49, 50, 51, 52, 53, 53, 56, 58, 59, 70, 75 1. Find the range of both sets of data (boys and girls). Which has a larger range? 2. Find the mean and the median of the boys heights. Which one best describes the average height of the boys? why? 3. Find the mean and the median of the girls heights. Which one best describes the average height of girls? why?
Mean and Medians are both ways to find the “central middle” of a set of data. • However, they are each “the best” at different times. As you saw in the problems earlier the boys mean and medians were relatively close. This is because the boys heights were evenly spread out. • In this case mean is the best way to tell what the middle of the heights are because it is slightly more accurate. • The girls, on the other hand, had a median that was significantly lower than the mean. This is because 2 of the girls heights were much taller than the rest. • In this case the median is the best way to tell what the middle of the heights are because it is unaffected by the 2 extremely tall girls (outliers). • Rule: Whenever the data has an outlier the better measure of the middle is the median, because the median is unaffected by outliers. However, if there are no outliers than the better measure of the middle is the mean, because it more accurately represents all the data.
Warm-Up • The following are test grades for Mr. Hoyt’s algebra class: • 100, 78, 95, 33, 88, 91 • 1. Find the mean and the median of the data above. • 2. Which one (the mean or the median) is the better measure of central tendency in this problem? Why?
Mean Absolute Deviation (MAD) of a numerical set of data is the average deviation of the data from the mean. • The MAD is calculated by first finding the mean () Then subtracting the mean from a data value. Once you have done this for each data value you then take the absolute value of all the new values. Lastly add these new values to each other and divide by the total number. • Example: Find the MAD for the following set of data: 11, 5, 7, 5, 6, 10, 12 Step 1: Find Step 2: do x- for each value. Step 3: Find the absolute value for each number obtained in step 2. Step 4: Find the average of the numbers from step 3. MAD =
Video and Practice finding MAD • http://www.youtube.com/watch?v=z9AJk7TvdpQ • Find the mean absolute deviation for each data set below 1) 5, 9, 11, 4, 12, 15, 7 2) 12, 8,9,4,3,2,4 3) 8,9,7,11,17,15,10 4)14,6,5,15,9,11,3
Warm-up • 3) This table shows admission price for various museums in the same city. • Museum Prices: • $9.00 $12.00 $9.75 $8.25 $11.25 • Which is the mean absolute deviation for this set of data?
Quartiles A quartile is a type of median of an ordered set of data. However it is not the middle number like a median is. If you divide a set of data in half (a upper half, and a lower half) the upper quartile is simply the median or middle of the upper half of data, and the lower quartile is the median or middle of the lower half of data. Example: Looks at the data set: 22,23,24,25,26,27,27,27,28,30,31 Interquartile Range (IQR) is Q3 – Q1 In the problem above the IQR is 28-24=4 Upper Half Lower Half Q1 Lower Quartile Q3 Upper Quartile Median
http://www.youtube.com/watch?v=WYxtE1Q6_GE • For 1 and 2 Find the Q1, Q3, and IQR • 41, 37, 58, 62, 46, 33, 74, 51, 69, 81, 55 2) 182, 149, 172, 161, 68, 179, 142, 187, 170, 155 3) Using the data from #2 you will find the MAD is 22.8. Compare this with the IQR you got in #2. Which one (IQR or MAD) best describes the spread of the data? Why?
Which Conclusion is NOT true? The interquartile range of the texts is the same for both sent and received. The lower quartile for the text sent is lower than the lower quartile for text received. The mean and median of texts sent were higher than the mean and median for texts received. The upper quartile for the text received was lower than the upper quartile for texts sent.
The five number summary is made up of the minimum, Q1, Median, Q3, and Maximum values. • Box and whiskers plot is a graph of the 5 number summary. • Example: Find the 5 numbers Sum, The IQR, and make a box and whiskers plot for the data: • 42, 42, 44, 45, 46, 46, 48, 49, 52, 53, 56 Med Q3 Q1 Max Min 40 41 42 43 44 45 46 47 48 49 50 51 52 53 54 55 56
When comparing multiple box plots to decide which one has the highest or lowest average you want to look the 5 number summary of each plot to see how they compare. Here class 1 is ALL relatively small compared to the other boxes. It has the lowest max, the 2nd lowest Q3 and 2nd lowest median and the 2nd lowest Q1. All of the other box plots have significantly higher Maxes and Q3s.
Practice: Create a box and Whiskers plot for the following problems. 1. 11, 16, 18, 17, 20, 10, 14, 10, 17, 12, 15 2. 10, 63, 52, 40, 8, 12, 73, 49, 26, 57, 32, 19 10 11 12 13 14 15 16 17 18 19 20 10 20 30 40 50 60 70 80