Download
1 / 14
140 likes | 223 Views
High resolution simulation of August 1 AMMA case: impact of soil moisture initial state on the PBL dynamics and comparison with observations. S. Bastin (1) , C. Taylor (2) , A. Boone (3). With contributions/help from : D. Bou Karam, D. Parker, N. Asencio, J. Escobar, P. LeMoigne.

E N D
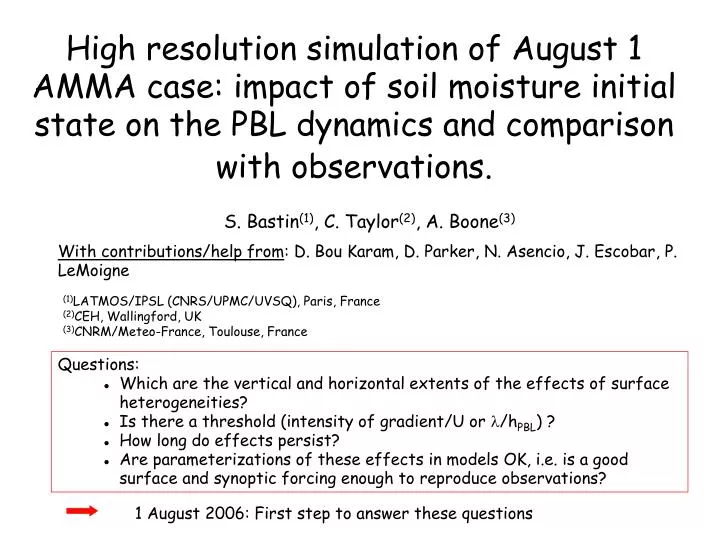
High resolution simulation of August 1 AMMA case: impact of soil moisture initial state on the PBL dynamics and comparison with observations. S. Bastin(1), C. Taylor(2), A. Boone(3) With contributions/help from: D. Bou Karam, D. Parker, N. Asencio, J. Escobar, P. LeMoigne (1)LATMOS/IPSL (CNRS/UPMC/UVSQ), Paris, France (2)CEH, Wallingford, UK (3)CNRM/Meteo-France, Toulouse, France • Questions: • Which are the vertical and horizontal extents of the effects of surface heterogeneities? • Is there a threshold (intensity of gradient/U or /hPBL) ? • How long do effects persist? • Are parameterizations of these effects in models OK, i.e. is a good surface and synoptic forcing enough to reproduce observations? 1 August 2006: First step to answer these questions
Synoptic situation of 1 August case Flight over storm track 18 hours later 31 July @ 17 UTC: Convective system over Niger/Mali Niamey Storm track Flight track Courtesy: Chris Taylor 1000 km Polarisation ratio anomalies from TRMM Spatial resolution ~ 50 km
PBL temperature according to ECMWF forecast model Land surface temperature anomaly (satellite) Observed PBL temperature PBL gradient due to vegetation feature Storm track: Note within-storm variability due to individual convective cells Summary of data analysis (1) From Taylor et al., GRL, 2007 Spectral analysis shows that LSTA and PBL temperature are correlated up to scales of ~ 5 km. Amplitude of effects is variable. Which resolution is necessary for modelling studies?
Convergence Divergence Divergence Convergence Convergence Summary of data analysis (2) Wind at 170 m Land surface temperature anomaly Surface gradients are strong enough to generate thermally-induced circulations. What are the spatial (vertical) extent and life cycle of these circulations?
MESONH Simulations Version MASDEV4_7_2 2 domains: 12 et 3 km 57 vertical levels Initialised at 00Z on 1 August 2006. Surface model = ISBA ECM Simulation SWI Simulation • Atmos. 3D fields: ECMWF (~1°) • Surface fields: ECMWF (~1°) • Atmos. 3D fields: ECMWF (~1°) • Surface fields: Tsoil and soil moisture from ALMIP simulations (~50 km) (off-line mode of ISBA) Soil moisture at 0600 UTC BAe flight track Strong soil moisture variability before sunrise No soil moisture variability in the area of interest
Comparisons MESONH/OBS (1330 UTC) SWI2: more humidity in the 2nd and 3rd soil layers than in SWI1 Temperature bias Dropsondes (~ 15 UTC)
Wind difference 10 m wind difference: REF-SWI1 ~200 m AGL wind difference: REF-SWI1 More wind divergence in SWI1 than in ECM over the moist soil : in agreement with obs
Time evolution of temperature Simulation ECM Simulation SWI T2- 1000 UTC T2- 1000 UTC T2- 1300 UTC T2- 1300 UTC Cold pool persists after soil moisture evaporation in the model
Problem of temperature bias Simulation chauffe trop Model outputs at 12Z MNH/ECM MNH/ALMIP 12 UTC 1330 UTC Model outputs at 1330 UTC Midday ECMWF analysis
MESONH/ECMWF MESONH/ARPEGE WRF/NCEP Tests with other analyses, other model (1) WITHOUT ALMIP WITH ALMIP • Nouvelles simulations: • MesoNH forcé par ARPEGE (avec et sans ALMIP) • MesoNH forcé par ECMWF sans aérosols (non montré ici, très peu de différences) • WRF forcé par NCEP (avec et sans ALMIP) • WRF forcé par ECMWF (sans ALMIP + tests sur patchs humides en cours)
Problem of temperature bias MNH-ECM (13 UTC) MNH-ARP (13 UTC) WRF-ECM (13 UTC) WRF-NCEP (13 UTC) ECMWF midday ana. NCEP midday ana. BAE observations (1330)
Problem of temperature bias Midday NCEP analysis Midday ECMWF analysis NCEP warmer than ECMWF in the northern part
ECM (13 UTC) ECM/ALMIP (13 UTC) ARP (13 UTC) ARP/ALMIP (13 UTC) WRF-NCEP (13 UTC) WRF-NCEP/ALMIP ECMWF midday ana. ARPEGE midday ana. BAE observations (1330) Tests with other analyses, other model (2) • ALMIP has a strong impact on the PBL thermodynamics in the 3 couples of simulations. • The impact on the wind can be locally strong: to be analized • None of the simulations is able to reproduce Q variability.
Conclusion and perspectives • Technical problems: • Impact of ALMIP is considerable • Temperature bias: aerosols, clouds or dynamics? • Resolution of ALMIP probably not high enough to answer the question of scales of correlation • Scientific questions: • For this case, surface strongly influences temperature variability while humidity variability is influenced by other processes. Analyse transport of air masses to better evaluate the relative importance of advection VERSUS local effects in observations and in the model. • Effects of surface are not visible within the whole PBL and persistence of the effects of surface after evaporation : is the method of correlation always pertinent? • Run ‘semidealized simulations with artificial modifications of SM to test the scales of correlation, life cycle of circulation… Fig. Variability of surface T (shading), T2m (blue), T at 170m AGL (green) and T 925hPa (red) along track in simulation SWI1.


![CP = E[ s 2 , s 5 , s 1 , s 3 , s 2 ’ , s 3 ’ , s 4 , s 1 ’ , s 4 ’ , s 5 ’ ] S[] I[]](https://cdn3.slideserve.com/6546826/slide1-dt.jpg)