Download

1 / 38
380 likes | 464 Views
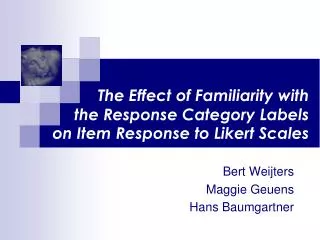
The Effect of Language on Response Distributions in Likert Data. Bert Weijters Maggie Geuens Hans Baumgartner. The non-equivalence problem in cross-national research. Surveys are popular in cross-national marketing research

E N D
The Effect of Language on Response Distributions in Likert Data Bert Weijters Maggie Geuens Hans Baumgartner
The non-equivalence problem in cross-national research • Surveys are popular in cross-national marketing research • However, one common concern is that survey responses may not be equivalent across countries: • the same response (e.g., ‘4’ on a five point-agree/ disagree scale) may have a different meaning for different respondents (e.g., in different countries); • sources of non-equivalence: • Item-specific (different meanings attached to a particular item) • General (i.e., over multiple tems)
Remedies for non-equivalence • Non-equivalence of responses to individual items has been addressed: • Procedurally: back-translation (Kumar 2000) • Statistically: measurement invariance testing of item parameters such as item loadings and intercepts (Steenkamp and Baumgartner 1998; He, Merz, and Alden 2008) • Non-equivalence due to biases that are not item-specific has been partially addressed: • Multiple response styles have been identified and statistical remedies have been suggested (Baumgartner and Steenkamp 2001; De Jong et al. 2008) • Response styles have been related to national culture (Harzing 2006; Johnson et al. 2005; Van Herk, Poortinga and Verhallen 2004)
Research objective • General non-equivalence (i.e., bias not specific to a particular item) has been attributed to national culture; • However, nationality and language have been consistently confounded; • The present investigation aims to • Assess the effect of language on response bias (resulting in shifts in response distributions), controlling for nationality; • Explain the mechanism underlying the language effect studied;
A multi-step investigation into cross-regional non-equivalence Study 1: Cross-regional European survey
Study 1 Does nationality or language lead to greater similarity in responses to heterogeneous Likert items? “Natural” experiment using native speakers of different languages in Europe who share or do not share the same nationality;
Method: Measuring response distributions • A major challenge is to measure bias in response distributions that is not item-specific and independent of substantive content; • To do this, we need to observe patterns of responses across heterogeneous items (i.e., items that do not share common content but have the same response format): • Deliberately designed scales consisting of heterogeneous items (Greenleaf 1992) • Random samples of items from scale inventories (Weijters, Geuens & Schillewaert 2010)
Method: InstrumentGreenleaf 1992 scale (16 items) #(one) #(two)
Hierarchical clustering of regions by response category proportions (Ward’s method)
A multi-step investigation into cross-regional non-equivalence Study 1: Cross-regional European survey Study 2: Experiment with bilinguals
Study 2 • Are differences in response distributions due to language mainly related to respondents’ mother tongue (i.e., an individual characteristic) or the language of the questionnaire (i.e., a stimulus characteristic)? • In particular, does the use of different category labels within each language affect the response distributions? • Response category labels are a potential systematic source of differences in response distributions since they are constant across items but variable across languages; • Even within the same language, response distributions may differ if different response category labels are used;
Study 2: Design Belgian panel : 24.33% incidence rate of bilingualism Dutch / French Respondents were randomly assigned to the four questionnaire versions
Study 2: Design (cont’d) • Dependent variable: • 16-item Greenleaf (1992) scale; • 16 heterogeneous Likert items sampled from as many unrelated marketing scales; • the two sets of measures achieved convergent validity and were combined; • demographic background variables; • language profile (language proficiency and use of Dutch/French);
Statistical analysis Score Statistics For Type 3 GEE Analysis Chi- Source DF Square Pr > ChiSq Language 1 4.21 0.0402 Label(Language) 2 24.82 <.0001 Mother_tongue 1 0.12 0.7297 Language*Mother_tongue 1 2.56 0.1097 Label(Language)*Mother_tongue 2 1.81 0.4043 Scale Category 3 391.22 <.0001 Scale Category*Language 3 19.85 0.0002 Scale Category*Label(Language) 6 72.96 <.0001 Scale Category*Mother_tongue 3 4.93 0.1773 Scale Category*Language*Mother_tongue 3 3.98 0.2631 Scale Category*Label(Language)*Mother_tongue 6 6.34 0.3860
Discussion Study 2 • response distributions do not seem to differ as a function of a respondent’s mother tongue; • the language of the questionnaire and the labels used for the scale categories can have a substantial influence on how readily certain positions on the rating scale are endorsed: • even within the same language, supposedly similar labels strongly affected responses to items that were presumably free of common content; • in a multi-language context, where category labels do differ across languages but are common across items within the same language, the labels attached to different scale positions can be a potent source of response bias;
A multi-step investigation into cross-regional non-equivalence Study 1: Cross-regional European survey Study 2: Experiment with bilinguals Study 3: Label experiment (single language) Study 4: Cross-continental label experiment
Note Henceforth, we will focus on the endpoint labels: • This avoids the confounding effects of the labels of adjacent categories (e.g., is the frequency of ‘4’ responses due to the label of categories 3, 4 or 5?); • Extreme response style has been the focus of much recent cross-cultural research (e.g., Arce-Ferrer 2006; Clarke 2001; De Jong et al. 2008); • In practice, scales in which only the endpoints are labelled are most prevalent (Weijters, Cabooter & Schillewaert, forthcoming);
Two alternative hypotheses to explain the effect of response category labels • H1: Endpoint labels with higher intensity are less frequently endorsed. • H2: Endpoint labels with higher fluency are more frequently endorsed.
H1: Intensity hypothesis Extreme endpoint label Shifting boundary Narrow category Low frequency 2 3 4 5 6 7 1 Overt Likert response Latent construct • Item Response Theory: • respondents map their standing on the latent variable onto the response category that covers their position on the latent variable (Samejima 1969; Maydeu-Olivares 2005); • the wider the response category, the more likely respondents are to endorse it; • more intense endpoint labels move the category’s lower or upper boundary away from the midpoint, resulting in lower response frequencies;
H2: Fluency hypothesis • Research on processing fluency shows that the meta-cognitive experience of ease of processing affects judgment and decision making: • perceptions of the truth value of statements (e.g., Unkelbach 2007) • liking for objects and events (e.g., Reber, Schwarz, and Winkielman 2004) • choice deferral or choices of compromise options (e.g., Novemski et al. 2007); • Repeated statements are more likely to be rated as true (Unkelbach 2007) and repetition increases liking, as suggested by the mere exposure effect (e.g., Bornstein 1989), in part because repetition makes stimuli more familiar and contributes to greater processing fluency; • Therefore, if scale labels are more commonly used in everyday language and are thus easier to process, this should increase the likelihood that the corresponding response option on the rating scale is selected;
Pre-test: Stimuli selection Pre-test among Dutch speaking students (N = 83) using 6 endpoint labels in Dutch (including the labels used in the previous study) Select two labels with intensity and fluency levels that would lead to contradictory effects under H1 and H2; Pilot intensity and fluency measure using pair-wise comparisons (“Which expression indicates the stronger sense of agreement?” and “Which expression is more commonly used in day-to-day speech?”);
Main experiment: Method • We randomly assigned Dutch speaking students (N = 100) to two alternative versions of a brief online questionnaire (10 hetero-geneousLikert items and pairwise comparisons); • In one version, the extreme categories were labelled ‘sterk (on)eens’ (‘strongly (dis)agree’), in the other version the extreme categories were labelled ‘volledig (on)eens’ (‘fully (dis)agree’); • The intermediate categories (disagree, neutral, agree) had the same labels in both versions;
Main experiment: Findings Note: In the bilinguals study, ‘volledigeens’ also had a higher endorsement frequency than ‘sterkeens’ (17% vs. 13%, respectively, p < .05). A generalized linear model analysis showed that the number of extreme positive responses was significantly lower in the ‘sterkeens’ (low intensity and fluency) condition than in the ‘volledigeens’ (high intensity and fluency) condition: means of 3.63 vs. 4.44 (χ21=3.998, p = .046); This result is consistent with H2: labels that are more fluent lead to higher response category frequencies (in this case despite their higher intensity);
A multi-step investigation into cross-regional non-equivalence Study 1: Cross-regional European survey Study 2: Experiment with bilinguals Study 3: Label experiment (single language) Study 4: Cross-continental label experiment
Multilevel results Estimate S.E. Est./S.E. P-Value Within Level ERS ON FEMALE 0.057 0.047 1.196 0.232 AGE -0.001 0.003 -0.279 0.781 EDU_HI -0.048 0.085 -0.560 0.575 Between Level ERS ON FLUENCY 0.165 0.064 2.594 0.009 INTENSITY -0.133 0.131 -1.014 0.311 LANG_FR 0.061 0.087 0.703 0.482 C_US 0.119 0.102 1.166 0.244 C_FR 0.007 0.076 0.091 0.927 C_UK 0.025 0.120 0.212 0.832 Intercept ERS 1.002 0.184 5.444 0.000
Discussion: summary of findings Study 1: Cross-regional European survey Response distributions are more homogeneous for regions sharing the same language than for regions sharing the same nationality.
Discussion: summary of findings Study 2: Experiment with bilinguals Response distributions vary as a function of category labels, even within the same language and regardless of respondents’ mother tongue
Discussion: summary of findings Study 3: Label experiment (one sample) Highly fluent labels lead to higher endorsement rates of response categories, irrespective of label intensity (and keeping language constant) Study 4: Cross-continental label experiment This finding holds in a multilingual cross-continental setting, irrespective of language and nationality
Implications • Response style research • Need to extend the scope to questionnaire characteristics • Need to cross-validate/replicate earlier cross-national comparisons • Cross-cultural survey research • Reconsider regional segmentations • Validate measures cross-regionally rather than cross-nationally
Implications formultilingual survey research • Translations usually imply a trade-off between the attempt to be literal and the attempt to be idiomatic; • Optimize equivalence: use response category labels that are equally fluent in different languages (rather than literal translations or words with equal intensity); e.g., ‘Strongly agree’ is most commonly used in scales, but may not have valid equivalents in some other languages. ‘Completely agree’ seems to be a viable alternative. Currency ERS% Completely agree 1.24 18.8% Tout à fait d’accord 1.22 19.2%