Download
1 / 50
510 likes | 692 Views
Resolution Enhancement Compression- Synthetic Aperture Focusing Techniques. Student: Hans Bethe Advisor: Dr. Jose R. Sanchez Bradley University Department of Electrical Engineering. Motivation. Ultrasonic imaging (UI) is important in medical diagnosis.

E N D
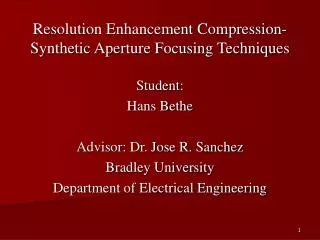
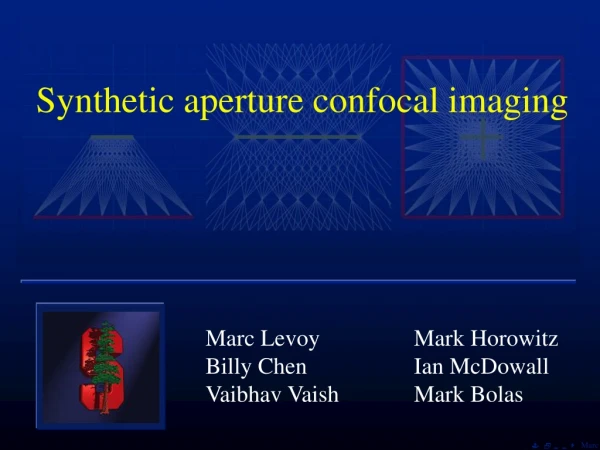
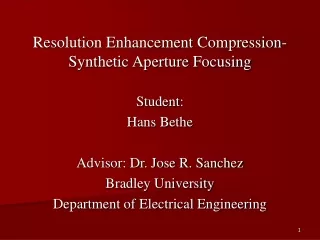
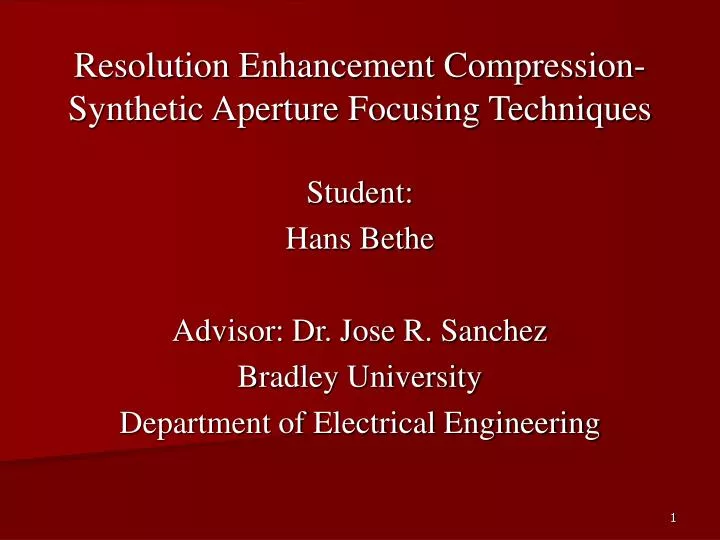
Resolution Enhancement Compression-Synthetic Aperture Focusing Techniques Student: Hans Bethe Advisor: Dr. Jose R. Sanchez Bradley University Department of Electrical Engineering
Motivation Ultrasonic imaging (UI) is important in medical diagnosis Figure 1: Ultrasound image of kidney stone [1] Figure 2: Ultrasound image of pancreas [2]
Motivation 1. One of the main concerns in UI: improving spatial resolution of ultrasonic images 2. Resolution Enhancement Compression (REC): a coded excitation (or wave-shaping) technique. Its functions: Produces a pre-enhanced chirp capable of improving axial resolution Improves SNR through compression 3. Synthetic Aperture Focusing Techniques (SAFT): a set of beam-forming techniques, capable of improving lateral resolution and SNR by delay processing 4. Objectives: Investigate and simulate REC and SAFT independently Combine REC and SAFT to determine the improvement in both lateral and axial directions as well as SNR
Outline I. Ultrasonic imaging system II. REC III. SAFT IV. Functional requirements V. Simulation results
I. Ultrasonic Imaging System REC (excitation) SAFT (delay processing) REC (compression) Image reconstruction system Transducer Figure 3: Block diagram
Transducer An electro-mechanical device used to convert signal or energy of one form to another In imaging, converts electrical signal to ultrasonic signal Transducer Target Ultrasonic pulses Echoes Figure 4: Ultrasound emission and reflection
Image Reconstruction System excitation Pre- amplifier Matched filter Delay Unit A Transducer Echo image A Apodization Σ
Image Reconstruction System excitation Pre- amplifier Matched filter Delay Unit A Transducer Echo image A Apodization Σ
Image Reconstruction System excitation Pre- amplifier Matched filter Delay Unit A Transducer Echo image A Apodization Σ
Image Reconstruction System excitation Pre- amplifier Matched filter Delay Unit A Transducer Echo image A Apodization Σ
Image Reconstruction System excitation Pre- amplifier Matched filter Delay Unit A Transducer Echo image A Apodization Σ
Image Reconstruction System excitation Pre- amplifier Matched filter Delay Unit A Transducer Echo image A Apodization Σ
REC: a coded excitation and pulse compression technique Coded excitation amounts to wave-shaping Coded excitation involves generating the pre-enhanced chirp excitation signal, capable of artificially increasing a transducer’s bandwidth => yields higher axial resolution (axial resolution = ability of imaging system to distinguish objects closely spaced along the axis of the beam) II. REC objects transducer beam axis beam Figure 5: Illustration of axial resolution
Pre-enhanced chirp is grounded on convolution equivalence principle
REC Mechanism Figure 6: Coded excitation illustration
REC Mechanism Figure 6: Coded excitation illustration
REC Mechanism Figure 6: Coded excitation illustration
REC Mechanism Figure 6: Coded excitation illustration
The 2nd central aspect of REC is pulse-echo compression, accomplished by a Wiener compression filter • γ : varies the operating point of β(f) between inverse filter and matched filter states • V’lin-chirp(f): frequency spectrum of modified linear chirp.
The 2nd central aspect of REC is pulse-echo compression, accomplished by a Wiener compression filter • γ : varies the operating point of β(f) between inverse filter and matched filter states • V’lin-chirp(f): frequency spectrum of modified linear chirp. The original linear chirp cannot be used in β(f) because the pre-enhanced chirp is tapered by Hanning window => convolution equivalence principle no longer holds.If original linear chirp is used, β(f) will yield considerable side lobes => need modified linear chirp
SAFT = synthetic aperture focusing techniques = different beam-forming techniques Different techniques exist: Generic synthetic aperture (GSA) Synthetic transmit aperture (STA) Synthetic receive aperture (SRA) Synthetic transmit and receive aperture (STRA) III. SAFT
SAFT = synthetic aperture focusing techniques = different beam-forming techniques Different techniques exist: Generic synthetic aperture (GSA) Synthetic transmit aperture (STA) Synthetic receive aperture (SRA) Synthetic transmit and receive aperture (STRA) III. SAFT
STA emission 1 emission 2 emission 3 emission 4 reception 1 reception 2 reception 3 reception 4 LRI 1 LRI 2 LRI 3 LRI 4 Σ Figure 7: Illustration of STA
The essence of STA is delay-and-sum (DAS) operation Transducer L6 L3 L1 L9 pulses Target Figure 8: Illustration of DAS
The essence of SAFT is delay-and-sum (DAS) operation Transducer L6 L3 L1 L9 echoes pulses Target Figure 8: Illustration of DAS
The essence of SAFT is delay-and-sum (DAS) operation Transducer L6 L3 L1 L9 echoes pulses Target Figure 8: Illustration of DAS
The essence of SAFT is delay-and-sum (DAS) operation Delay processing Transducer Transducer L6 L3 L1 L9 echoes pulses Target Figure 8: Illustration of DAS
The essence of SAFT is delay-and-sum (DAS) (or focusing in reception) processing Delay processing Σ Transducer Transducer L6 L3 L1 L9 echoes pulses Target Figure 8: Illustration of DAS
A/ STA Transducer shall be a linear array comprising 128 elements STA shall be performed through MATLAB Field II STA mode: synthetic transmit aperture (STA) Delay and sum calculations shall be performed through a GPGPU Total synthetic aperture processing time shall be < 1 second Signal-to-noise ratio (SNR) of the images shall be at least 50 dB IV. Functional Requirements
III. Functional Requirements B/ REC • Actual impulse response h1(t) of transducer shall have a frequency of 2 MHz. • Transducer bandwidth shall be about 83%. • Sampling rate shall be 400 MHz. • Impulse response h2(t) of desired transducer shall have a bandwidth about 1.5 times the bandwidth of h1(t). • The side lobes associated with compressed pulse shall be reduced below 40 dB.
Figure 9: Coded excitation simulation result (time-domain signals)
Figure 9: Coded excitation simulation result (time-domain signals)
Figure 10: Coded excitation simulation result (frequency spectra)
Quality metrics used to assess REC 1/ Signal-to-noise ratio (SNR) - SNR of conventional pulsing (CP): 38.49 dB - SNR of REC: 47.83 dB => SNR is improved when REC is utillized 2/ Modulation transfer function: used to determine the axial resolution of the system
k0 = wave number at which MTF curves attains 0.1 Figure 13: MTF of CP and REC
Quality metrics used to assess STA 1/ Signal-to-noise ratio (SNR) - SNR before delay processing: 36.89 dB - SNR after delay processing: 50.44 dB => SNR is improved after delay processing is implemented 2/ Modulation transfer function: used to determine the axial resolution of the system
Pre-delay k0 = 407.3 m-1 Post-delay k0 = 454.1 m-1 Axial improvement factor = 1.11 Figure 15: Axial resolution simulation result
References [1] Ultrasound image gallery http://www.ultrasound-images.com/renal-calculi.htm [2] Ultrasound images gallery http://www.ultrasound-images.com/pancreas.htm [3] http://sell.bizrice.com/selling-leads/48391/Digital-Portable-Color-Doppler-Ultrasound-System.html [4] J. R. Sanchez et al., "A Novel Coded Excitation Scheme to Improve Spatial and Contrast Resolution of Quantitative Ultrasound Imaging" IEEE Trans Ultrasonics, Ferroelectrics, and Frequency Control, vol. 56, no. 10, pp. 2111-2123, October 2009. [5] S. I. Nikolov, “Synthetic Aperture Tissue and Flow Ultrasound Imaging [6] T. Misaridis and J. A. Jensen, “Use of Modulated Excitation Signals in Medical Ultrasound” IEEE Trans. Ultrason. Ferroelectr. Freq. Control, vol. 52, no. 2, February 2005. [7] M. L. Oelze, “Bandwidth and Resolution Enhancement Through Pulse Compression”, IEEE Trans. Ultrasonics, Ferroelectrics, and Frequency Control, vol. 54, no. 4, April 2007.
References [8] J. R. Sanchez and M. L. Oelze, “An Ultrasonic Imaging Speckle-Suppression and Contrast-Enhancement Technique by Means of Frequency Compounding and Coded Excitation”, IEEE Trans. Ultrasonics, Ferroelectrics, and Frequency Control, vol. 56, no. 7, Julyl 2009. [9] M. Oelze, “Improved Axial Resolution Using Pre-enhanced Chirps and Pulse Compression”, 2006 IEEE Ultrasonics Symposium [10] Tadeusz Stepinski, “An Implementation of Synthetic Aperture Focusing Technique in Frequency Domain”, IEEE transactions on Ultrasonics, Ferroelectrics, and Frequency control, vol. 54, no. 7, July 2007 [11] J. A. Zagzebski, “Essentials of Ultrasound Physics’
Apodization • Process of varying signal strengths in transmission and reception across transducer • Reduces side lobes • Signal strength will become progressively weaker with increasing distance from the center • Control beam width => improve or degrade lateral resolution Center Figure 5: Illustration of apodization
objects echoes Figure 7: Effect pulse duration has on axial resolution
Beam width and lateral resolution • Lateral resolution = capability of imaging system to distinguish 2 closely spaced objects positioned perpendicular to the axis of ultrasound beam • Larger beam width => greater likelihood of pulses covering objects => echoes from reflectors more likely to merge => degrade lateral resolution beam axis transducer beam objects 1 2 3 Figure 5: Illustration of the effect beam width has on lateral resolution