Download
1 / 12
120 likes | 237 Views
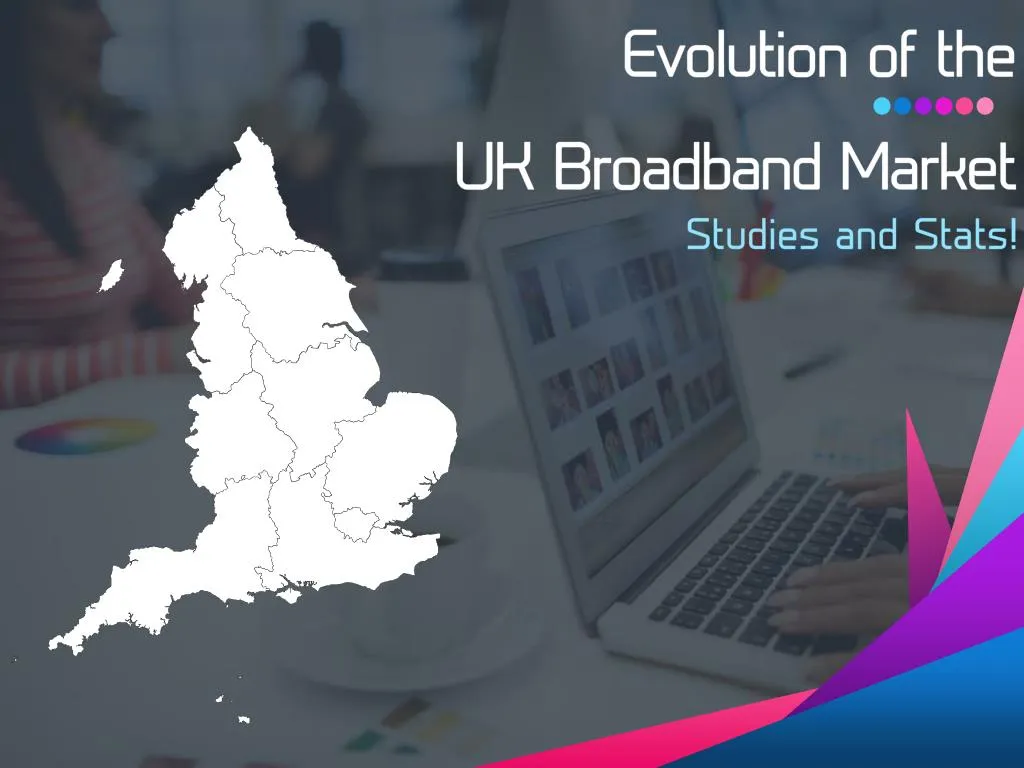
Statistics suggest that the UK broadband market has evolved over the years and a much higher number of people are choosing high speed broadband services. From 83% people using superfast broadband with 29Mbit/s speed in 2015 to 89% in 2016, it is a steady growth curve. Apart from businesses, households are also using superfast speed as it was recorded that average households are consuming 132 GB data on monthly basis in 2016 which is a big jump from 97 GB in 2015. Still 1.4 million premises are unable to get broadband with speed 10Mbit/s or more. This technological wave will go forward as around 10 million more connections are expected by 2020. With such remarkable progress, the UK broadband market which is infamous for poor speeds and low network capability has finally picked up towards a progressive future! However, you need to know the best suppliers and how much to spend in your broadband services. For that we can be your best help as we compare all broadband providers across the UK. To know more about comparison services, visit our site https://freepricecompare.com/broadband/ or contact our team on 02034757476.

E N D
SNEAK PEEK INTO THE MARKET 24.7 Million Fixed Broadband Connection by 2015 1 Average actual fixed broadband speed 28.9 Mbit/s 2 Fixed internet spending rose by 12% in 2015 3 Consumers are switching to superfast broadband which costs £10 more than standard broadband. 4
BROADBAND REACH & SPEED 25.5 m premises (89%) have superfast broadband with avg. download speed 37Mbit/s 2016 1.4 m premises (5%) without standard broadband (10Mbits/s or less) 24 m premises (83%) have superfast broadband with avg. download speed 29Mbit/s 2015 2.4 m premises (8%) without standard broadband (10Mbits/s or less)
Household across the UK consumed an average 132 GB Data per month in 2016, Up from 97 GB in 2015. Quick Facts 31%of UK premises now subscribe superfast broadband however it is an option for 89% of UK premises
AVAILIBILITY OF SUPERFAST BROADBAND In Year 2016 100% 38 Mbit/s highest download speed in England. 90% 90% 85% 84% 83% 83% 79% 77% 80% 73% 70% 60% 29 Mbit/s lowest download speed in Wales. 50% 40% 30% 20% 10% 0% England Scotland 2015 Wales 2016 Northern Ireland
AVAILIBILITY OF SUPERFAST BROADBAND IN RURAL AREAS 70% 62% UK Government introduced Universal Service Obligation (USO) that give people the legal right to request a broadband connection with 10Mbit/s speeds. It will enhance the decent broadband availability in rural areas. 57% 60% 54% 52% 50% 46% 45% 40% 40% 31% 30% 20% 10% 0% England Scotland 2015 Wales 2016 Northern Ireland
EMERGING TECHNOLOGIES To meet the demand for higher speeds G. Fast: By 2020, around 10 million homes and businesses will get superfast broadband using this technology. It has potential to deliver speed up to 330 Mbit/s. Long Range VDSL: It is an emerging technology has the potential to deliver speed up to 40Mbit/s and upload speed up to 10Mbit/s. It is better than Fiber to the cabinet (FTTC) technology. Next Generation Cable: Virgin media is working on the same and started Delivering superfast speed up to 300Mbit/s. Later versions of this technology may achieve Speeds of up to 10Gbit/s and upload speed up to 1Gbit/s.
80% Take-up of 68% 70% 63% BUNDLED SERVICES 7% 1% 60% 6% 2% 1% 1% 2% 50% “Nearly seven in ten households (68%) reported buying at least two of their communications services together in a bundle in 2016.” 2% 28% 40% 25% 30% 20% 29% 27% 10% 0% 2015 2016 Others Mobile and Broadband Fixed voice, broadband, mobile and TV Fixed voice and TV Fixed voice, broadband and TV Fixed voice and Broadband
UK ADULTS TIME SPENDING IN A DAY Time spent by UK adults (24 hours) 6:55 hours 8:45 hours “ UK adults spend majority of their time (8h 45m) in media and communication activities, it is 27 minutes more than they sleep (8h 18m) in a day. ” 8:18 hours Media and Communication Activities Sleep Other Activities
10 Complaints per 100,000 customers Q3 2016 40 36 BROADBAND 35 30 30 26 25 19 20 15 11 10 7 5 0 BT Plusenet EE TalkTalk Virgin Media Sky Complaints per 100,000 customers Industry Average is 20. Except TalkTalk, all five broadband providers failed to decrease complaints in Q3 2016. In Q2 2016, There were 21 complaints reported which is 19 in Q3.
11 Get in Touch UK’s #1 Price Comparison Website 17 Park Road, High Barnet, Barnet, England- EN5 5RY 0203 4757 476 / 0800 977 5741
12 Thanks for Watching FreePriceCompare @freepricecompare @freepricecompa Note: All data used here is taken from OfCom Research.