Download
1 / 12
120 likes | 302 Views
Analysis of recovery of plastic waste in the building and construction sector (2010). February 2012. Background. Building and construction (B&C) is responsible for over 20% of demand for plastics in Europe It is the second largest market segment for plastics after packaging

E N D
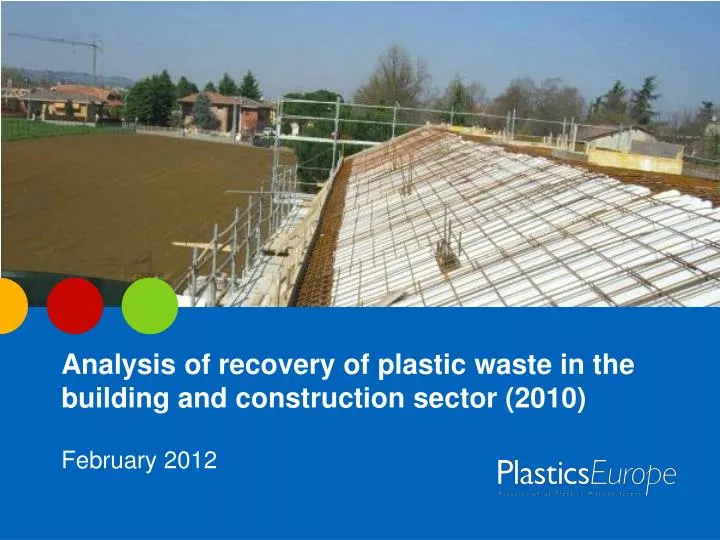
Analysis of recovery of plastic waste in the building and construction sector (2010) February 2012
Background • Building and construction (B&C) is responsible for over 20% of demand for plastics in Europe • It is the second largest market segment for plastics after packaging • A wealth of data exists for the recovery of plastic packaging waste across Europe • However, to date there has little or no analysis of plastics waste management in the B&C sector • To address this gap PlasticsEurope commissioned an independent study by Consultic into plastics waste in the B&C sector in the 27 EU Member States (EU27) plus Norway and Switzerland
Total Plastic Waste vs. Plastics Waste in B&C in EU-27+2 in 2010 Total Plastics Waste by Polymer Total Plastics B&C Waste by Polymer • Polyethylene (PE), all types combined, accounts the largest share of plastic waste across all sectors. • Polyvinylchloride (PVC) accounts for the largest share of plastics waste in B&C • Although responsible for over 20% of demand for plastics, the B&C sector only accounts for 5.5% of total plastics waste
Plastic B&C Waste by application B&C Plastic Waste by Building & Construction applications in EU27+2 (2010) • Insulation accounts for the largest share of plastic waste in the Building & Construction sector • Followed closely by pipes and ducts and by flooring and wall coverings.
Treatment of plastic B&C waste in EU27 plus Norway and Switzerland • Rate of mechanical recycling of building/construction plastic waste increased significantly from 2009 to 2010 • In 2010 20.0% (in 2009: 15.8%) of the total building/construction plastic waste in the EU 27 + 2 countries were mechanically recycled.36.2% were energetically recovered mainly in waste incineration plants and as RDF. • This results in an overall recovery rate of building/construction plastic waste of 56.2% in 2010 comparedto 51.9% in 2009.
Treatment of plastic B&C waste in EU27 plus Norway and Switzerland
Recovery of plastic B&C wastein building and construction • As in the packaging sector, trends in recovery of building and construction plastic waste demonstrate large disparities across the EU 27+2. • 8 countries have recovery rates >80% (Austria, Belgium, Denmark, Germany, Netherlands, Norway, Sweden and Switzerland) • 6 countries with no recovery of building/construction plastic waste and a further 3 with less than 5%
Recovery and disposal of plastic B&C waste in EU27+2 and by country (2010)
Recovery and disposal of plastic B&C waste in EU27+2 and by country (2010) • A total of 56.2% of plastics B&C waste was diverted from landfill in 2010 through a combination of recycling (20%) and energy recovery (36.2%). • Germany provides an example of what can be achieved with the right infrastructure in place, recovering over 96% of plastics B&C waste in 2010. • Meanwhile, in Italy and Spain over 80% still ended up in landfill. • While the UK leads the way in terms of recycling rates (31.5%) it still sent roughly two thirds of its waste to landfill in 2010 due to minimal use of energy recovery. • Scandinaviancountries have overall recovery rates of almost 80% due to a strong use of energy recovery.
Recovery and disposal of plastic B&C waste in EU27+2 and by country (2010)
Recovery and disposal of plastic B&C waste in EU27+2 and by country (2010) • Significant mechanical recycling activities in Germany, UK, France, Italy, Netherlands and Poland and Spain. These countries cover more than 80% of the recycling activities. • Strong energy recovery activities could be identified in Germany, France, Netherlands, Belgium, Austria, Switzerland, Denmark and Sweden. • The total recycling quantity increased from 211 kt in 2009 to 273 kt in 2010.