Download
1 / 44
440 likes | 550 Views
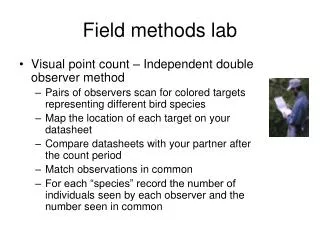
DQO Training Course Day 3 Module 22. Field Analytical Methods. Presenter: Sebastian Tindall. (15 minutes) (15 minute 2 nd Afternoon Break). 1 of 44. Subsurface Imaging using DPT Rigs, Sensor Technology and Onsite Analysis Tools. Direct Sensing Technology

E N D
DQO Training Course Day 3Module 22 Field Analytical Methods Presenter: Sebastian Tindall (15 minutes) (15 minute 2nd Afternoon Break) 1 of 44
Subsurface Imaging using DPT Rigs, Sensor Technology and Onsite Analysis Tools Direct Sensing Technology A fundamentally better approach for mapping the subsurface For Brownfields, Property Transfers, NPL sites and TRIAD Projects
The Problem • Heterogeneity is the norm • Most investigations are not defensible • Too few samples • Samples are not representative • Sampling error supercedes lab error • Most clean-up efforts fail A much larger number of data points are required to reduce uncertainty.
Managing Uncertainty • EPA’s TRIAD Approach • Systematic Planning • Real Time Measurements • Dynamic Work Plans • The 7-Step Data Quality Objective Process
SmartData SolutionsTM A comprehensive approach integrating recent advances in: • Sensor technology • Rapid computational analysis • Interactive 3D webcasts
SmartData SolutionsTM We can now quickly and reliably: • Provide comprehensive images of the subsurface. • Manage uncertainty and assess risk. • Avoid downstream failures and costs. • Monitor remediation performance. • Obtain more cost-effective closure.
SmartData - A continuous stream of chemical and physical data, available in a geo-referenced, digital and user-friendly format. Use it for the 3D imaging of subsurface sources, pathways, soil types remediation effectiveness Integration with other site data, such as: Constituent-specific data from discrete samples Physical features from surface and subsurface SmartData SolutionsTM
Advantages of SmartData? • Large amounts of geo-referenced, digital data that can be rapidly reviewed, processed, posted and displayed for real time analysis and decision making. • Data that is easily correlated and cross-checked with other data.
Types ofSmartData • The MIP/EC Probe for Fuels and Solvents • Membrane Interface Probe/ Electrical Conductivity • MIP/CPT • LIF/UVIF – SCAPS/ROST/FFD for Fuels • Laser Induced or UV Fluorescence +/- MIP • LIF/CPT • Range of Emerging Tools
Membrane Interface and Conductivity Probe • For detecting LNAPL, DNAPL,dissolved phase and gas phase VOCs. • For locating sources and plumes in vadose and saturated zones, in sands and clays. • For locating hydrologic and geologic units. • For assessing risk of mass transport. • For monitoring treatment effectiveness
Multiple Platforms • Direct push rigs • CPT units • Drill rigs • Waterborne • All-terrain track • Indoor – limited access
SmartData SolutionsTM Investigation Strategy • Use MIP/EC to obtain detailed logs of site. • Generate comprehensive 3-D image. • Then select “more fully representative” discrete samples for analysis. • Make decisions, focus monitoring/treatment and close sites, based on the “whole picture”.
SmartData SolutionsTMSite Assessment Benefits • Fewer but better sample and monitoring well locations. • Stop endless investigations! • Prevent/limit the big problem sites.
Minimum MIP-PID Response Note the plume appears unbounded at these locations
Same Site - plume based on limited lab results DPT Sample Results Color indicates BTEX concentration in ug/L BTEX plume based on DPT results – less resolution
SmartData SolutionsTMRisk Assessment • Calculate contaminant mass per hydrogeologic unit • Determine mass available for migration • Determine risk from available mass • Assess monitoring options vs remedial options per hydrogeologic unit
SmartData SolutionsTMRisk Assessment Benefits • Provide adequate basis for RBCA. • Remove Regulator’s uncertainty. • Increase confidence in fate and transport modeling with more data density.
SmartData SolutionsTM Remediation Strategy • Use detailed MIP and EC data to assess risk and, if needed, to focus treatment. • Clearly differentiate available mass. • Target units with available mass. • Monitor treatment effectiveness with second MIP survey.
Feasibility Assessment Benefits • Understand location of chemicals relative to geology. • Understand pathways and treatment potential. • Treat only if rational. • Focus each treatment.
Value of SmartData SolutionsTM to Expedited Site Characterization The data collected with these tools are: • Of higher resolution, thus fewer interpretive mistakes. • Available immediately, can be used for real-time decision making. • Geo-referenced and digital, so images are created daily for focusing activities.
Benefits from using SmartData SolutionsTM • More complete source characterization than traditional phased approach. • Better source and plume delineation in relationship to stratigraphy = more realistic, effective, and targeted remediation. • Net Result: • More realistic planning • Quicker assessments and cleanups • Lower overall project cost
A Management Tool for Lowering Costs and Risks A systematic approach for assessing sites that: • Provides accurate image of the subsurface. • Delivers immediate onsite data for direction of site investigation efforts. • Electronic data and webpage makes it is easier to manage - Standard deliverables. • Reduces catastrophic cost and PR exposures • Is more reliable and lowers cost
How does SmartData SolutionsTM lower costs? • Reduces time on site and need for revisits. • Reduces need/# of lab samples. • Reduces need/# of monitoring wells. • Expedites reporting. • Provides better documentation for Monitored Natural Attenuation, Technical Impracticability or RCRA based closures.
SmartData SolutionsTM helps you win more projects • Allows you to meet tight schedules. • Easier to develop Work Scope. • Provides flexibility to optimize field work. • Greater accuracy reduces mistakes. • 3D images enhances communication and deliverables.
Summary • SmartData SolutionsTM Lowers Costs and Increases Success in: • Source area and plume characterization • Migration pathway delineation • Remediation effectiveness • Performance monitoring • Verification sampling With higher resolution data, presented as a comprehensive 3D image of the subsurface, while the teams are still in the field.
State-of-the-art SmartData SolutionsTM is a fundamentally better approach that incorporates: • Multiple sensor technologies • Rapid 3D processing • Live interactive webcasts
How to turn SmartDataTMinto Smart Decisions The Strategic Use of Data • Data (broader and deeper) • Information (organized data) • Intelligence (processed/analytics) • Knowledge (add human experience) • Consulting (knowledge management) • Intervention (actionable) “Follow the Science”
Value Proposition If using SmartData SolutionsSM will • lower your assessment costs • help you assess risk • lower your treatment costs • gain quicker regulatory acceptance How can you reap the benefits of these advances in sensor technology, rapid computational analysis and data delivery on your next project?
The SmartData Accelerator Program (SDAP) Join Industry/Government Group to: • Test, deploy and evaluate emerging sensors and advanced sampling techniques. • Optimize data handling, visualization tools and delivery systems. • Set direct sensing, data delivery and project management standards.
For further information: J. Edward “Ned” Tillman, Columbia Technologies 1450 So Rolling Rd Baltimore, MD 21227 410-536-9911 410-536-0222 (Fax) ntillman@columbiadata.com http://www.columbiadata.com
Case Studies http://www.columbiadata.com/coltech/aol_gmail.cfm?id=31
Field Analytical Methods FAM Toolbox = FAM Matrix • Web Sites: • http://fate.clu-in.org/ • http://www.frtr.gov/site/ 43 of 44
End of Module 22 Thank you Questions? We will now take our second 15 minute afternoon break. Please be back in 15 minutes. 44 of 44