Download
1 / 35
400 likes | 1.02k Views
Fundamentals of Operations Management BUS 3 – 140 Aggregate Planning & Master Scheduling Oct 9, 2007. Capacity Planning Review. Definitions. Design capacity Maximum output rate or service capacity for which an operation, process, or facility is designed Effective capacity

E N D
Fundamentals ofOperations ManagementBUS 3 – 140Aggregate Planning & Master SchedulingOct 9, 2007
Definitions • Design capacity Maximum output rate or service capacity for which an operation, process, or facility is designed • Effective capacity Design capacity minus allowances such as personal time, maintenance, and scrap • Actual output Rate of output actually achieved--cannot exceed effective capacity. * From Stevenson, Operations Management, Ninth Edition, McGraw Hill Irwin
Measures of Capacity (Table 5.1) * From Stevenson, Operations Management, Ninth Edition, McGraw Hill Irwin
Constraints Anything that LIMITS a system in reaching its Goal Types of Constraints: • Resource • Material • Supplier/Vendor • Financial • Knowledge/Competence • Policy
Fixed and variable Costs • Fixed Costs • Remain CONSTANT regards of level of Volume • Rent • Manager salaries • Insurance • Overhead • Variable Costs • Vary directly with Volume of Output • Total Material Cost • Total Beware of ABSORBING OVERHEAD (amortizing Fixed Costs) as a justification for producing more than can be Sold
Potential Bottleneck Operations (2 Examples) Bottleneck Operation 120/hr. Operation 210/hr. Operation 315/hr. 10/hr. Maximum output ratelimited by bottleneck 40 Units coming in every hour, but only 30 going out Machine #1 10/hr Machine #2 Bottleneck Operation 10/hr 30/hr Machine #3 10/hr Machine #4 10/hr
Bottleneck True Definition A Constraint that causes REVENUE to be Lost IMBALANCE IMBALANCE IMBALANCE Operation 120/hr. Operation 210/hr. Operation 315/hr. 10/hr. Unless more than 10 units per hour can be SOLD, the Operations are Imbalanced but not a true bottleneck
Breakeven Exercise Page 194 of Book
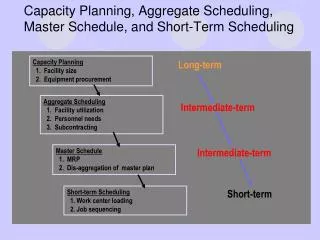
Intermediate Planning (Table 13.1) Intermediate Plans Short-Range Plans Long-Range Plans General levels of: • Employment • Output • Finished Goods Inventory • Subcontracting • Backorders • Long-term capacity • Location • Layout • Product Design • Work System design Detailed Plans: • Machine loading • Job assignments • Job sequencing • Production Orders • Work schedules * From Stevenson, Operations Management, Ninth Edition, McGraw Hill Irwin
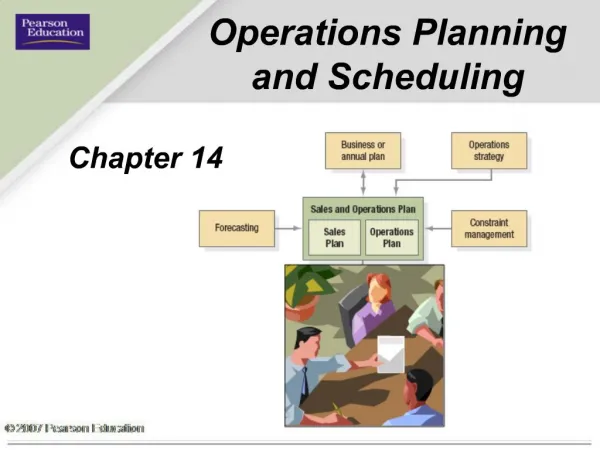
Economic, competitive, and political conditions Corporate strategies and policies Aggregate demand forecasts Establishes operations and capacity strategies Business Plan Establishes operations capacity Aggregate plan Establishes schedules for specific products Master schedule Intermediate Planning (Figure 13.1) * From Stevenson, Operations Management, Ninth Edition, McGraw Hill Irwin
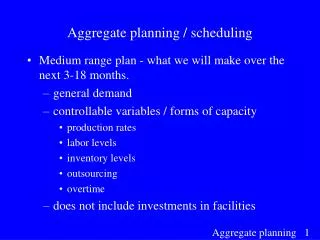
Aggregate Planning • Focus on Quantity and Timing of expected Demand (forecast) • Start with Multiple plans and choose the most appropriate one • Factor in Revenue, Market Share, and Inventory targets • Estimate the impact of Product Transitions
Aggregate Planning Inputs and Outputs (Table 13.2) * From Stevenson, Operations Management, Ninth Edition, McGraw Hill Irwin
Demand Options • When Demand does not match Capacity then alter (i.e. Influence) demand • Pricing • Promotion • New demand to smooth peaks and valleys (e.g. Bus taking kids on field trips during the school day) • Points out a useful application of the economic concept of Elasticity of Demand
Capacity Options • Hire workers and / or layoff workers • Attraction and Retention risk • Skill set replacement • Union issues • Hiring and layoff costs • Part time workers and contractors • Work schedule adjustments • Overtime • Second (and third) shifts • Sending workers home • Four day weeks • Inventories • Subcontracting, offloading, outsourcing
Managing Uneven Load • Level Load • Chase • Develop Business Rules • No more than x% of forecasted demand • Never short an order • No more than 110% of capacity • No more than 50% in last month of Quarter • Other
Managing Uneven Load (Table 13.3) CHASE Approach Capacities are adjusted to match demand requirements over the planning horizon LEVEL Approach Capacities are kept constant over the planning horizon * From Stevenson, Operations Management, Ninth Edition, McGraw Hill Irwin
Techniques for Aggregate Planning • Know your Demand • Know your CAPACITIES (including Flex up or down) • Account for company policies on Layoffs, costs, overtime, etc.. • Agree on The Plan • Draw the Capacity Line and the Load bars against it
Summary of Techniques for Aggregate Planning (Table 13.7) True Optimization is rare, but the analysis is useful to drive Business Rules and formal decision criteria * From Stevenson, Operations Management, Ninth Edition, McGraw Hill Irwin
Aggregate Planning in Services • Cannot stock Finished Goods Inventory • Demand is Perishable • Input is highly variable • Cross train people to increase effective capacity • Yield Management (Airlines)
The Master Schedule “disaggregates ” the Aggregate Plan Figure 13.4 Figure 13.5 Aggregate Planning Aggregate Plan Jan Feb Mar Lawn Mowers 200 300 400 Disaggregation Master Schedule Jan Feb Mar Push Mowers 100 100 100 Power Mowers 75 150 200 Riding Mowers 25 50 100 Total 200 300 400 Master Schedule * From Stevenson, Operations Management, Ninth Edition, McGraw Hill Irwin
The Master Scheduling Process (Figure 13.6) Outputs Inputs • Beginning Inventory • Forecast • Orders • Projected Inventory • Master Production Schedule • Uncommitted Inventory PROCESS * From Stevenson, Operations Management, Ninth Edition, McGraw Hill Irwin
Additional Key Points in Master Scheduling • Rough Cut Capacity Planning • Time Horizons • Time Fences • “Available to Promise” The most valuable part of the job is knowing when to say, “Yes” and when to say, “No”
Time Fences “frozen”(firm orfixed) “liquid”(open) “slushy”somewhatfirm Only Executive Exception would authorize a Change Only Executive Exception would NOT authorize a Change Changes are likely to be accepted, but require Research and / or Business Case
Time Fences can be Dynamic Typical Technology Manufacturer Dell Computer Cargo Airplanes for the US Dept. of Defense Restaurant Burger King • Generally varies by Lead Time to obtain Materials and Capital equipment • Goal is to minimize the Red and Yellow and keep FLEXIBILITY and RESPONSIVENESS to a maximum
Sales & Operations PlanningA bridge between Aggregate Planning & Master Scheduling
Sales & Operations Planning (S&OP) Purpose • Senior Management Alignment on Revenue and Supply plans • Greater accountability of individual plans • Consensus on managing gaps Output • Judged Revenue Plan • Master Build Schedule • Contingency plans • Documented agreements and planned outcomes
Key S&OP Inputs, by Function • Unconstrained Forecast • Execution to Plan • Capacity • Materials Plan • Time to Volume • Buffer Targets Sales Operations BU’s Finance • Prelim. Revenue Plan • GM Revenue objectives • Profitability scenarios • Prelim. Budgets • Prelim. FGI Targets • Return on Invested Capital • Market Trends & TAM • Share expectations • Customer TAM expectations • Roadmaps and Transitions
S&OP Output is a Consensus Plan • Constrained Revenue plan • Accountability for Forecast Accuracy • Standard, system-generated, accuracy metrics • Defined ownership by Sales and Marketing • Joint ownership of FGI between Sales and Operations • MPS tied to single plan of record and business rules • Published Lead Times • Integrated Revenue plan • Credible EPS guidance • Exception Loops between meetings
Reasons for Carrying Inventory • Revenue • Have what Customers want, when they want it • Compensate for non-linear demand that doesn’t match your capacity • Buffer for upside demand • Buffer for when competitors cannot deliver • Buffer against unexpected internal supply problems Carrying Buffer inventory is necessary, but continuous, relentless efforts to minimize variability, and thus eliminate the need for the Buffers is greatly preferred
Reasons for Carrying Inventory • Cost • Minimize shortages, to avoid delays and idle time • Optimize plant, people, and equipment utilization • Obtain volume discounts for favorable unit pricing • Hedge against future price increases Optimizing utilization and unit pricing are valuable only when the goods made or purchased will SOLD to a paying Customer in a reasonable time The cost of a STOCKOUT is hard to quantify, but is to be AVOIDED at all times
Types of Inventory Maintenance, Repair, & Operating Supplies (MRO) Raw Materials Resale Items Work In Process (WIP) Finished Goods (FGI) Manufacturing All Chocolate Cake Finished Goods Cake Icing Subassembly (WIP) Raw Material Water Egg Mix MRO Raw