Download
1 / 21
210 likes | 429 Views
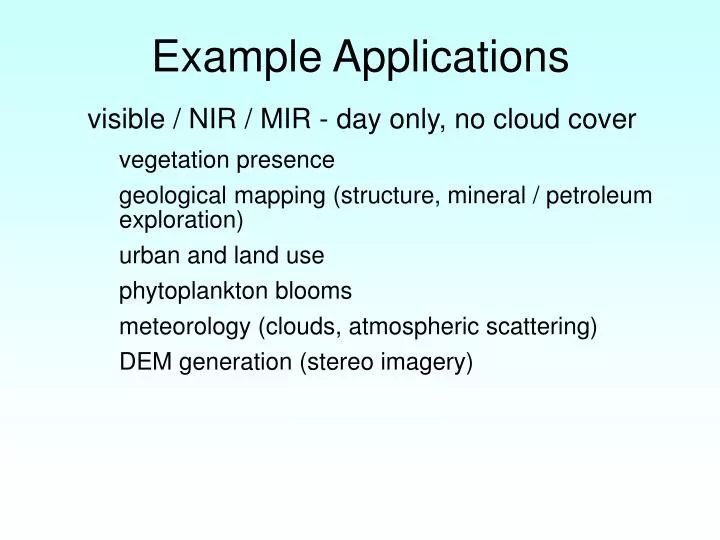
Example Applications. visible / NIR / MIR - day only, no cloud cover vegetation presence geological mapping (structure, mineral / petroleum exploration) urban and land use phytoplankton blooms meteorology (clouds, atmospheric scattering) DEM generation (stereo imagery).

E N D
Example Applications • visible / NIR / MIR - day only, no cloud cover • vegetation presence • geological mapping (structure, mineral / petroleum exploration) • urban and land use • phytoplankton blooms • meteorology (clouds, atmospheric scattering) • DEM generation (stereo imagery)
Example Applications • Thermal infrared - day / night, rate of heating / cooling • heat loss (urban) • thermal plumes (pollution) • mapping temperature • geology • forest fires • meteorology (cloud temp, height)
Example Applications • Active microwave - little affected by atmospheric conditions, day / night • surface roughness (erosion) • water content (hydrology) - top few cms • vegetation - structure (leaf, branch, trunk properties) • DEM production (SAR interferometry)
App 1: Pemetaan Kedalaman Objective : To extract depth information from satellite data, and to devise a fast and cost-effective alternative for acquiring depth information Study Area : Pulau Tioman Satellite remote sensing data Landsat Thematic Mapper - band 1 Determination of depth information Elimination of atmospheric & geometric errors Computation of depth Depth information in digital file Production of Hydrographic Chart
Depth information in digital file Production of Hydrographic Chart Digital File of Depth Information Automatic Generation of Hydrographic Chart
App 2 : Pemetaan Dasar Laut Determination of sea bottom features Elimination of atmospheric & geometric errors Formation of “depth invariant index” for sea bottom features Classification of sea bottom features based on depth invariant Objective : To extract sea bottom information from satellite data and to devise a fast and cost-effective alternative for acquiring sea bottom information Study Area : Langkawi
Product from Sea bottom feature mapping Production of “Sea bottom features” Plan • Sea bottom features information is vital for : • navigational hazards • monitoring • dredging operation • exploration • offshore engineering • fisheries application
App 3 : Water Quality Objective : To map water quality and determine suspended sediment from satellite data Study Area : Straits of Klang Satellite remote sensing data Landsat Thematic Mapper - band 1 Automatic Production of SSC Maps
Radar Remote Sensing for Land and Coastal Applications Wave Spectra Analysis Detection of Oil Slicks Mapping of Natural & Artificial Features Modelling for Vegetation Backscattering Modelling Shallow Water Bathymetry Objectives : To develop a suitable methodology for mapping coastal features and land cover using multi-temporal ERS-1 SAR satellite data Study Area : Kuala Terengganu & Baram, Sarawak
Research 7 : Vegetation Index Mapping Objective : Identifying & analysing biomass for vegetation mapping Study Area : Raub, Pahang Data from Red and Infrared Bands of Landsat-5 TM and NOAA AVHRR Satellites Computation of Vegetation Indices Correlation of index to ground biomass
Research 8 : Sea Surface Temperature Mapping AVHRR Data of NOAA Satellite were used to derive regional SST coverage of 1000 km2. Landsat-5 TM band 6 was used for sub-regional SST coverage of 185 km2. Determination of SST Elimination of “noises” and “errors” Customizing thermal algorithms Classification of SST Automatic generation of SST Map Objective : To determine sea surface temperature (SST) from satellite data at regional and sub-regional levels Study Area : Straits of Malacca & South China Sea surrounding Peninsular Malaysia
Research 8 output : SST is one of the prime input into analysis of fisheries / marine research. SST can be associated with pelagic fish species, hence, offers a “powerful” forecasting tool in deep sea fishing industries of Japan and Nordic countries. Automatic Generation of Sea Surface Temperature off coastal waters surrounding Peninsular Malaysia
Global Rainforest Mapping Activities in Malaysia: Radar Remote Sensing For Forest Survey and Biomass Indicator Retrieval of tree parameters for model generation Mangrove forest segmented from SAR data. Biomass Estimation Map over study area JERS-1 SAR data over Sg. Pulai, Johore Figure 1 Figure 2 Figure 3 Figure 4 Figure 1 : Measurement of in-situ data for biomass obsevation. Figure 2 : Determination of mangrove patches using specific segmentation algorithm. Figure 3 : Corrected image of JERS-1 SAR (Synthetic Aperture Radar ) of study area. Figure 4 : Biomass estimation map over study area. Figure 5 : Survey of the study area carried out jointly with Johore Forestry Department. Figure 5 Field verification of calculated biomass
Phytoplankton sampling at the time of satellite pass in the study area.
Ocean colour and seagrass mapping from satellite remotely sensed data for fisheries application Phytoplankton distribution of Kedah waters (Landsat image ) Ocean colour mapping (NOAA satellite) Seagrass distribution in Kedah waters ( Landsat image ) Derived sea-grass (a)and ocean colour (b) covering Langkawi island
Spectral Signature : Surface Surfaces don’t reflect all wavelengths equally. They tend to absorb certain wavelengths, while reflecting others.The percentage of reflectance across the Electromagnetic Spectrum that a surface reflects is called its spectral signature.Spectral signatures can be affected by the time of year, weather, and environmental factors.
Spectral Signature: Vegetation For example, vegetation tends to reflect green light at a higher reflectivity than blue or red light, thus plants appear green to our eyes. Vegetation also has a high spectral response in the Near Infrared (NIR) and if our eyes could see this wavelength, then plants would appear very bright to us. • Blue – 0.4um-0.5um • Green – 0.5um-0.6um • Red – 0.6um-0.7um • Near Infrared (NIR) – 0.7um-1.2um
Spectral Signature: Water The spectral signature for water exhibits moderate reflectance in the visible portion of the Electromagnetic Spectrum, but plunges to almost nothing in the NIR.In images displaying NIR, water appears black because of its low reflectivity in the Near Infrared. • Blue – 0.4um-0.5um • Green – 0.5um-0.6um • Red – 0.6um-0.7um • Near Infrared (NIR) – 0.7um-1.2um