Download
1 / 16
160 likes | 298 Views
Ivonna Reda. Environmental Factors and Risk Areas of West Nile Virus in Southern California, 2007 – 2009. Hua Liu & Qihao Weng. Background. WNV – West Nile Virus West Nile Virus is a mosquito -borne virus , which normally transmits from bird to mosquito to bird

E N D
Ivonna Reda Environmental Factors and Risk Areas of West Nile Virusin Southern California, 2007–2009 Hua Liu & Qihao Weng
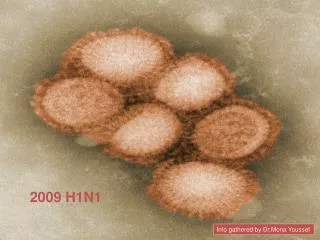
Background • WNV – West Nile Virus • West Nile Virus is a mosquito-borne virus, which normally transmits from bird to mosquito to bird • Humans can become infected when bitten by mosquitoes that carry virus • Most recently, the epidemic was widespread in Southern California, USA, setting for this study
WNV transmission • The transmission of WNV is dependent on the presence of the bird host and the mosquito vector • Environmentalconditions and social–economic factors, or urbanization, may impact the presence of these species • Mosquitoes reproduce and survive in hot, humid environments (urban heat island) • Birds are commonly found in highly developed, urbanized areas
What they want to test • The idea was to implement a disease surveillance method of WNV • They used knowledge of environmental conditions andlandscapesof ten counties to make a map, separating them instead into ecological zones based on environmental similaritiesto better understand why WNV spreads where it does • Using a clustering method
Methods Cluster analysis is the grouping of space into a specific ecological zones. • Since the ten counties contains diverse landscape and environmental conditions, it is necessary to generate homogeneous ecological zones for those counties • Factors include surface temperature, elevation, average precipitation, landscape patterns (forests, open) • Derived from remote sensing images, historical weather observation, and real-time remotely sensed land surface temperature and vegetation water content on WNV invasion
Methods Data collected from: • Centers for Disease Control and Prevention • California Vector-borne Disease Surveillance System • Geographic Information Systems (GIS)
Areas of study • The following ten counties in California constitute the study area: San Luis Obispo, Kern, San Bernardino, Santa Barbara, Ventura, Los Angeles, Orange, Riverside, San Diego, and Imperial. • Temperature difference between coastal counties and inland countiesis about 4°F in winter and approximately 23° F in summer
Timeframe Studies took place: • May - June (weeks 18–26) • July - August (weeks 27–35) • September - October (weeks 36–44) in each year of 2007–2009 • Consists of late spring/early summer, summer, and late summer/early fall.
Results • South San Joaquin Valley in Kern County and south Los Angeles County were the mostvulnerable locations for WNV outbreak. • Main factors contributing to the WNV propagation included summer mean temperature, annual mean deviation from the mean temperature, land surface temperature, elevation, landscape complexity, landscape diversity
Droughts • The moderate drought conditions in 2006and warmer than normal temperature contributed to the amplification of virus across southern California, for ex. Kern and Los Angeles in 2007. • The severe to extreme drought conditions in 2007 and warm springmay contribute to the outbreak of WNV in summer 2008
Results • 2006 was not included in the study, but it is necessary to show how the droughtmay affect the outbreak of mosquito population in the following year • Mosquito infection usually started to expand in May, reaching a peak in early or middle August (summer) except in 2004 and 2006. The infection generally ended in late November or December. • 2008 received the greatest total number of positive mosquito pools, most likely because of the drought of 2007 while year 2006 received the fewest mosquito infections. • Temperature must be above the minimum temperature (58°C) required for virus replication in mosquitoes for WNV to be disseminated throughout the year, especially in the cold months, and this was the case in Kern and Los Angeles • Lower elevations means higher temperatures, in which mosquitoes thrive • Higher landscape diversity is usually associated with multiple land cover types such as urban, grass, and water, which attracts birds
Sources • Liu, H., Qh Weng. 2012. Environmental Factors and Risk Areas of West Nile Virus in Southern California, 2007-2009. Environmental Modeling and Assessmant 17:441-452.