Download
1 / 29
290 likes | 370 Views
Considering Emissions of other non-CO 2 Greenhouse Gases: Ozone-depleting substances and substitutes matter: “The climate protection already achieved by the Montreal Protocol alone is far larger than the reduction target of the first commitment period of the Kyoto

E N D
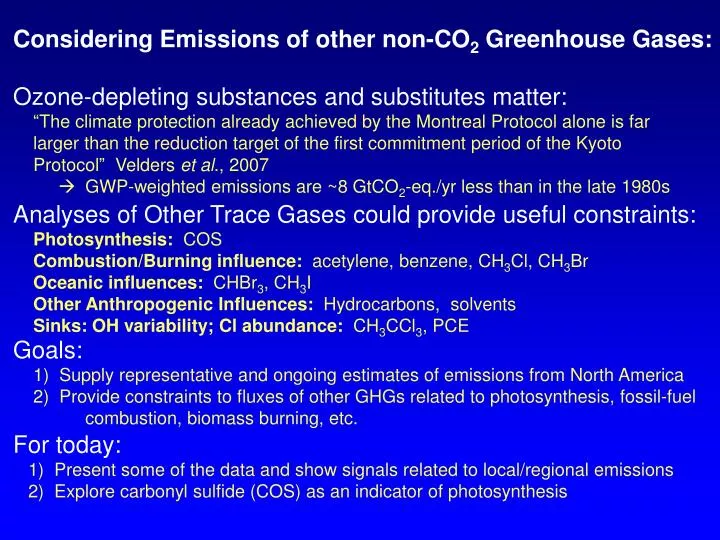
Considering Emissions of other non-CO2 Greenhouse Gases: Ozone-depleting substances and substitutes matter: “The climate protection already achieved by the Montreal Protocol alone is far larger than the reduction target of the first commitment period of the Kyoto Protocol” Velders et al., 2007 GWP-weighted emissions are ~8 GtCO2-eq./yr less than in the late 1980s Analyses of Other Trace Gases could provide useful constraints: Photosynthesis: COS Combustion/Burning influence: acetylene, benzene, CH3Cl, CH3Br Oceanic influences: CHBr3, CH3I Other Anthropogenic Influences: Hydrocarbons, solvents Sinks: OH variability; Cl abundance: CH3CCl3, PCE Goals: 1) Supply representative and ongoing estimates of emissions from North America 2) Provide constraints to fluxes of other GHGs related to photosynthesis, fossil-fuel combustion, biomass burning, etc. For today: 1) Present some of the data and show signals related to local/regional emissions 2) Explore carbonyl sulfide (COS) as an indicator of photosynthesis
Acknowlegements From HATS group: L. Miller, B. Miller, C. Siso, and J. Elkins From CCGG group: A. Andrews, C. Sweeney, A. Karion, S. Wolter, J. Kofler, J. Higgs, P. Lang, K. Masarie, D. Neff, D. Guenther, and many others… Those involved in interpreting data thus far: P. Tans, J. Miller, M. Fischer, G. Petron, B. Miller, others… NACP, NOAA
Gases Routinely Measured in Flasks (by HATS/CCG GCMS) Strong Greenhouse Gases: HFCs 134a 152a 23 143a 227ea 125 365mfc PFC 218 HCFCs 22 141b 142b 124 CFCs 11 12 13 113 114 115 Indicators of specific processes: Photosynthesis: Carbonyl Sulfide Burning: Acetylene, Benzene, CH3Cl, CH3Br, (CO) Oceanic influence: CHBr3, CH3I, CH3Cl Anthropogenic input: C3-C5 Hydrocarbons PCE, CH2Cl2 Land influence: COS , CH3Cl , CHCl3 , (H2 ) Others… Other ODSs Brominated gases CS2
Observing variability & gradients on regional scales Monitoring trace gases in 3-D… 8 km Aircraft profiles Tall towers (400m) Near-surface Some local studies too (Colorado) Near-surface network: NOAA-halocarbon group—since early 1990s Aircraft (since 2004) and tall tower (since 2006-2008) networks: NOAA-carbon cycle (A. Andrews and C. Sweeney)
From Remote, Ground-based Surface Sites Across the Globe Mobile Air Conditioner Coolant
Aircraft data over North America—Large Emission Signals Aircraft, <4 km asl Aircraft, >4 km asl
HCFC-22 vs HFC-134a Aircraft data enhancement, < 3000 m, 2004-2007 HCFC-22 enhancement (ppt) HFC-134a enhancement (ppt)
HFC-152a vs HFC-134a--residuals HFC-152a enhancement (ppt) HFC-134a enhancement (ppt)
HFC-152a vs HFC-134a – aircraft <3000m HFC-152a HFC-152a HFC-134a HFC-134a HFC-152a HFC-152a HFC-134a HFC-134a Envelope of scatter explained partially by seasonality…
HCFC-142b vs HFC-134a residuals HFC-142b enhancement (ppt) HFC- 134a
142b vs 134a—all sites <3000m HFC-142b HFC-142b HFC-134a HFC-134a HFC-142b HFC-142b HFC-134a HFC-134a Envelope of scatter NOT explained partially by seasonality…
Southern Sites: TGC, WKT, SCA, SGP HFC-142b HFC-142b HFC-134a HFC-134a HFC-142b HFC-142b HFC-134a HFC-134a 142b vs 134a
Northern Sites: DND, LEF, NHA HFC-142b HFC-142b HFC-134a HFC-134a cma HFC-142b HFC-142b HFC-134a HFC-134a 142b vs 134a Scatter reflects spatial variability!
Conclusions related to non-CO2 GHGs: An ongoing, multi-faceted sampling & measurement program is providing data for many non-CO2 GHGs from multiple sites across the U.S. The data show large signals related to emissions, and emission variations Inferring emissions with different techniques ongoing/planned: With 14CO2 (J. Miller) With Radon (M. Fischer) With CO (S.M. et al.) With Carbon Tracker applied to other gases (G. Petron, L. Bruhwiler, K. Masarie, A. Jacobson) With back-trajectory models (STILT, FLEXPART) Are these gases easier to apply inversions to (than CO2, CH4…)?
Gases Routinely Measured in Flasks (by HATS/CCG GCMS) Strong Greenhouse Gases: HFCs 134a 152a 23 143a 227ea 125 365mfc PFC 218 HCFCs 22 141b 142b 124 CFCs 11 12 13 113 114 115 Indicators of specific processes: Photosynthesis: Carbonyl Sulfide Burning: Acetylene, Benzene, CH3Cl, CH3Br, (CO) Oceanic influence: CHBr3, CH3I, CH3Cl Anthropogenic input: C3-C5 Hydrocarbons PCE, CH2Cl2 Land influence: COS , CH3Cl , CHCl3 , (H2 ) Others… Other ODSs Brominated gases CS2
Benzene CO CH3Cl CH3Br F-134a F-22 Biomass Burning? Ocean Emission… CO2 Sampling Altitude (above sea level, km) COS C2Cl4 CO2 CH3I CHBr3 Western Canada (ESP) 3 Aug 2005
COS as an indicator of photosynthesis: COS uptake by vegetation: is the largest sink of this gas is modulated by stomatal conductance is catalyzed by same enzymes involved in photosynthesis Vegetative emissions of COS are small (unlike CO2) potentially unique insights are possible from COS data Observations of variability of COS and CO2 show interesting parallels—qualitatively consistent with terrestrial uptake being the main driver COS may provide insights into gross photosynthetic uptake of carbon… But, for COS, many uncertainties remain regarding… vegetative uptake, soil sink, oceanic fluxes, anthropogenic source…
P. Suntharalingam, in press, 2008 ? 490 ? 740 230 Potential large imbalance ? ? 96 505 Plus tropical (30S to 30N) source of 235 COS Global Budget (Gg S yr-1)(mod to Kettle et al., 2002) Net Sinks: Vegetation:240 - 1500 Soils:130 OH oxidation: 95 COS photolysis (strat.): 15 O atom oxidation: 10 Total sinks: 490 - 1750 Net Sources: Oceanic: Direct: 40 CS2 and DMS oxidation: 240 Anthropogenic: Direct: 60 CS2 oxidation: 120 Biomass burning: 90 Other (wetlands…): 60 Total sources: 610 (total lifetime of 1.5 - 6 yr) (Kettle et al. 2002; Sandoval-Soto et al. 2005; Montzka et al. 2007)
CO2 SH SH CO2 data from NOAA; hfm CO2 from B. Munger COS seasonal changes vs. CO2 COS Fraction of Year (0.00 = Jan)
COS and CO2 seasonal amplitudes are correlated Fit to NH only: Slope =6 ± 1 r2 =0.9 Broad scale variability for COS is closely related to CO2 throughout the NH CO2 data from NOAA, and B. Munger
Relative Uptake of COS / CO2 = 3 - 7 COS From aircraft, Mid-west sites… CO2 Regional scale gradients for COS above continents likely explain the broader scale seasonal variability (as is true for CO2) • A similar pattern also • observed at: • Northern and Eastern • sites (ERUs a bit larger) • If data are screened for • low HCFC or HFC • mixing ratios (cleaner • air) • A different pattern observed at Southern sites and Western sites… 6 - 8 km 4 – 6 km 2 – 4 km < 2 km
Jan Feb Mar Apr May Jun Jul Aug Sep Oct Nov Dec Aircraft Results From ALL SITES Color scheme: 5 to 8 km asl 2 to 5 km asl < 2 km asl Line represents an uptake ratio of ~6
Jun Jun Northern & Eastern Sites Mid-West Sites Jul Jul Aug Aug COS vs. CO2vs. Site Line represents an ERU of ~6 Color Scheme: Sample altitude (masl): Green: <2500 Blue: 2500-5000 Red: 5000-8000 Carbonyl Sulfide (ppt) CO2 (detrended; ppm)
Mid-West Sites COS vs. Hydrogen(a gas with a strong suface sink) Consistent correlation observed even during July… Perhaps CO2 in July was anomalous…? C3 vs C4 photosynthesis?? Or spatial variations in V(COS/CO2) ? Carbonyl Sulfide (ppt) Hydrogen
Recent papers on COS: Montzka et al. 2007: Observed relationship between COS and CO2 suggests: terrestrial biosphere controls NH seasonality and abundances; in SH it is oceans uptake in NH >> CO2 GPP vs NPP uptake? COS may provide broad scale constraints on photosynthesis Suntharalingam et al.: (in press): Quantitative analysis reaffirms importance of terrestrial ecosystem in NH and oceans in SH in controlling seasonality… global budget still quite uncertain Campbell et al.: (in press) 3-D model (US) of vertical gradients over North America during Jul-Aug: (STEM 6060km res. over US; MM5 met., CASA biosphere); Well simulated for CO2 (Boundary conditions from TM5) For COS (NASA/UCI&NCAR(?) and NOAA data), COS well simulated only when: FCOS = GPP * [COS]/[CO2] * V (COS/CO2) This makes uptake by vegetation the dominant flux in model… quantitative evidence that COS gradients during growing season may provide a measurement-based photosynthesis tracer STEM model, 60x60 resolution, hourly time step, MM5 meteorology CASA model GPP flux V(COS/CO2) from ecosystem-based lab/mapping (mean=2.2 over domain) Biosphere fluxes at 1x1 deg grid CO2 boundary conditions from TM5 ERU = (GPP/NEE)*V(COS/CO2) ERU = V(COS/CO2)/(1 - RES/GPP) ERU is smaller in C4 cropland regions—is this because RES/GPP is different or because V is different?
Conclusions Many ‘other’ chemicals being measured that are influenced by a wide range of processes: photosynthesis, anthropogenic input, combustion, biomass burning, oceans, uptake by land. How can this additional information be appropriately used? Despite large uncertainties on global scales, a US-scale study shows good consistency and reinforces notion that COS gradients may provide information on broad-scale photosynthesis. Considerations: Are the role of soils constrained sufficiently? Can COS provide delineation between C4 vs C3 vegetation? Are relative leaf-based uptake rates constrained sufficiently?