Download
1 / 43
430 likes | 436 Views
Learn how supply and demand interact to create balance in the marketplace. Understand the differences between market equilibrium and disequilibrium, and discover the effects of price ceilings and price floors. Explore the concepts of shortage, excess demand, excess supply, and how market forces push the market back towards equilibrium.

E N D
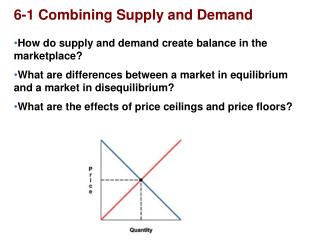
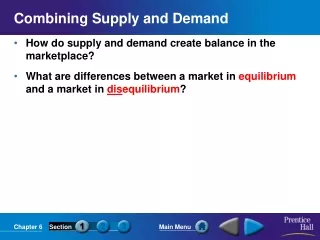
Combining Supply and Demand • How do supply and demand create balance in the marketplace? • What are differences between a market in equilibrium and a market in disequilibrium? • What are the effects of price ceilings and price floors?
The point at which quantity demanded and quantity supplied come together is known as equilibrium. Finding Equilibrium Equilibrium Point Combined Supply and Demand Schedule $3.50 $3.00 $2.50 $2.00 $1.50 $1.00 $.50 Price of a slice of pizza Quantity demanded Quantity supplied Result $ .50 300 100 Shortage from excess demand Price per slice a Equilibrium Price $1.00 250 150 $1.50 200 200 Equilibrium Equilibrium Quantity $2.00 150 250 Supply Demand Surplus from excess supply $2.50 100 300 0 50 100 150 200 250 300 350 350 $3.00 50 Slices of pizza per day Balancing the Market
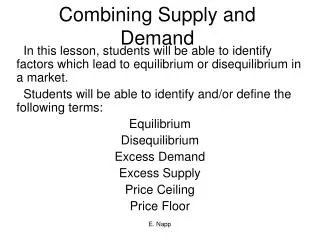
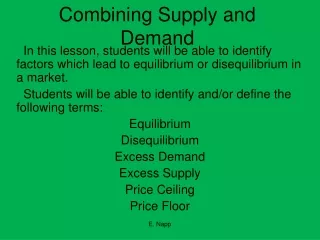
Excess Demand Excess demand occurs when quantity demanded is more than quantity supplied. Excess Supply Excess supply occurs when quantity supplied exceeds quantity demanded. Market Disequilibrium If the market price or quantity supplied is anywhere but at the equilibrium price, the market is in a state called disequilibrium. There are two causes for disequilibrium: Interactions between buyers and sellers will always push the market back towards equilibrium.
Shortage: • P • S • D • Q when quantity demanded is greater than quantity supplied • 0 • Example: If P = $1, • thenQD = 21 lattes • andQS = 5 lattes • resulting in a shortage of 16 lattes • Shortage
Shortage: when quantity demanded is greater than quantity supplied • P • S • D • Shortage • Q • 0 • Facing a shortage, sellers raise the price, • causing QD to fall • and QS to rise, • …which reduces the shortage.
Shortage: • P • S • D • Q when quantity demanded is greater than quantity supplied • 0 • Facing a shortage, sellers raise the price, • causing QD to fall • and QS to rise. • Prices continue to rise until market reaches equilibrium. • Shortage
Surplus: when quantity supplied is greater than quantity demanded • P • S • D • Q • 0 • Example: If P = $5, • Surplus • thenQD = 9 lattes • andQS = 25 lattes • resulting in a surplus of 16 lattes
Surplus: when quantity supplied is greater than quantity demanded • P • S • D • Q • 0 • Surplus • Facing a surplus, sellers try to increase sales by cutting the price. • Falling prices cause QD to rise and QS to fall. • Prices continue to fall until market reaches equilibrium.
Surplus: • P • Surplus • S • D • Q when quantity supplied is greater than quantity demanded • 0 • Facing a surplus, sellers try to increase sales by cutting the price. • This causes QD to rise • and QS to fall… • …which reduces the surplus.
Price Ceilings • A price ceiling is a maximum price that can be legally charged for a good. • An example of a price ceiling is rent control, a situation where a government sets a maximum amount that can be charged for rent in an area. In some cases the government steps in to control prices. These interventions appear as price ceilings and price floors.
A price floor is a minimum price, set by the government, that must be paid for a good or service. One well-known price floor is the minimum wage, which sets a minimum price that an employer can pay a worker for an hour of labor. Price Floors
Section 1 Assessment 1. Equilibrium in a market means which of the following? (a) the point at which quantity supplied and quantity demanded are the same (b) the point at which unsold goods begin to pile up (c) the point at which suppliers begin to reduce prices (d) the point at which prices fall below the cost of production 2. The government’s price floor on low wages is called the (a) market equilibrium (b) base wage rate (c) minimum wage (d) employment guarantee Want to connect to the PHSchool.com link for this section? Click Here!
Section 1 Assessment 1. Equilibrium in a market means which of the following? (a) the point at which quantity supplied and quantity demanded are the same (b) the point at which unsold goods begin to pile up (c) the point at which suppliers begin to reduce prices (d) the point at which prices fall below the cost of production 2. The government’s price floor on low wages is called the (a) market equilibrium (b) base wage rate (c) minimum wage (d) employment guarantee Want to connect to the PHSchool.com link for this section? Click Here!
Changes in Market Equilibrium • How do shifts in supply affect market equilibrium? • How do shifts in demand affect market equilibrium? • How can we use supply and demand curves to analyze changes in market equilibrium?
Shifts in Supply • Understanding a Shift • Since markets tend toward equilibrium, a change in supply will set market forces in motion that lead the market to a new equilibrium price and quantity sold. • Excess Supply • A surplus is a situation in which quantity supplied is greater than quantity demanded. If a surplus occurs, producers reduce prices to sell their products. This creates a new market equilibrium. • A Fall in Supply • The exact opposite will occur when supply is decreased. As supply decreases, producers will raise prices and demand will decrease.
Shifts in Demand • Excess Demand • A shortage is a situation in which quantity demanded is greater than quantity supplied. • Search Costs • Search costs are the financial and opportunity costs consumers pay when searching for a good or service. • A Fall in Demand • When demand falls, suppliers respond by cutting prices, and a new market equilibrium is found.
Graph A shows how the market finds a new equilibrium when there is an increase in supply. Graph A: A Change in Supply Graph B: A Change in Demand $800 $600 $400 $200 0 $60 $50 $40 $30 $20 $10 Supply a b Original supply c c Price Price a b New demand New supply Demand Original demand 0 1 2 3 4 5 100 200 300 400 500 600 700 800 900 Output (in millions) Output (in thousands) Analyzing Shifts in Supply and Demand • Graph B shows how the market finds a new equilibrium when there is an increase in demand.
Three Steps to Analyzing Changes in Equilibrium 1. Decide whether event shifts S curve, D curve, or both. 2. Decide in which direction curve shifts. 3. Use supply-demand diagram to see how the shift changes equilibrium P and Q. To determine the effects of any event,
EXAMPLE: The Market for Hybrid Cars • P • price of hybrid cars • S1 • P1 • D1 • Q • Q1 • quantity of hybrid cars
EXAMPLE 1: A Change in Demand EVENT TO BE ANALYZED: Increase in price of gas. • P • S1 • P2 • P1 • D2 • D1 • Q • Q1 • Q2 STEP 1: D curve shifts because price of gas affects demand for hybrids. S curve does not shift, because price of gas does not affect cost of producing hybrids. STEP 2: D shifts rightbecause high gas price makes hybrids more attractive relative to other cars. STEP 3: The shift causes an increase in price and quantity of hybrid cars.
EXAMPLE 1: A Change in Demand • P • S1 • P1 • D2 • D1 • Q • Q1 Notice: When P rises, producers supply a larger quantity of hybrids, even though the S curve has not shifted. • P2 Always be careful to distinguish b/w a shift in a curve and a movement along the curve. • Q2
Terms for Shift vs. Movement Along Curve Change in supply: a shift in the S curve occurs when a non-price determinant of supply changes (like technology or costs) Change in the quantity supplied:a movement along a fixed S curve occurs when P changes Change in demand: a shift in the D curve occurs when a non-price determinant of demand changes (like income or # of buyers) Change in the quantity demanded:a movement along a fixed D curve occurs when P changes
EXAMPLE 2: A Change in Supply EVENT: New technology reduces cost of producing hybrid cars. • P • S1 • S2 • P1 • P2 • D1 • Q • Q1 • Q2 STEP 1: S curve shifts because event affects cost of production. D curve does not shift, because production technology is not one of the factors that affect demand. STEP 2: S shifts rightbecause event reduces cost, makes production more profitable at any given price. STEP 3: The shift causes price to fall and quantity to rise.
EXAMPLE 3: A Change in Both Supply and Demand EVENTS: price of gas rises AND new technology reduces production costs • P • S1 • S2 • P2 • P1 • D2 • D1 • Q • Q1 • Q2 STEP 1: Both curves shift. STEP 2: Both shift to the right. STEP 3: Q rises, but effect on P is ambiguous: If demand increases more than supply, P rises.
Supply and Demand Together • P • S • D • Q • 0 • Equilibrium: P has reached the level where quantity supplied equals quantity demanded
EXAMPLE 1: A Change in Demand EVENT TO BE ANALYZED: Increase in price of gas. • P • S1 • P2 • P1 • D2 • D1 • Q • Q1 • Q2 STEP 1: D curve shifts because price of gas affects demand for hybrids. S curve does not shift, because price of gas does not affect cost of producing hybrids. STEP 2: D shifts rightbecause high gas price makes hybrids more attractive relative to other cars. STEP 3: The shift causes an increase in price and quantity of hybrid cars.
EXAMPLE 1: A Change in Demand • P • S1 • P1 • D2 • D1 • Q • Q1 Notice: When P rises, producers supply a larger quantity of hybrids, even though the S curve has not shifted. • P2 Always be careful to distinguish b/w a shift in a curve and a movement along the curve. • Q2
EXAMPLE 2: A Change in Supply EVENT: New technology reduces cost of producing hybrid cars. • P • S1 • S2 • P1 • P2 • D1 • Q • Q1 • Q2 STEP 1: S curve shifts because event affects cost of production. D curve does not shift, because production technology is not one of the factors that affect demand. STEP 2: S shifts rightbecause event reduces cost, makes production more profitable at any given price. STEP 3: The shift causes price to fall and quantity to rise.
Terms for Shift vs. Movement Along Curve Change in supply: a shift in the S curve occurs when a non-price determinant of supply changes (like technology or costs) Change in the quantity supplied:a movement along a fixed S curve occurs when P changes Change in demand: a shift in the D curve occurs when a non-price determinant of demand changes (like income or # of buyers) Change in the quantity demanded:a movement along a fixed D curve occurs when P changes
Section 2 Assessment 1. When a new equilibrium is reached after a fall in demand, the new equilibrium has a (a) lower market price and a higher quantity sold. (b) higher market price and a higher quantity sold. (c) lower market price and a lower quantity sold. (d) higher market price and a lower quantity sold. 2. What happens when any market is in disequilibrium and prices are flexible? (a) market forces push toward equilibrium (b) sellers waste their resources (c) excess demand is created (d) unsold perishable goods are thrown out Want to connect to the PHSchool.com link for this section? Click Here!
Section 2 Assessment 1. When a new equilibrium is reached after a fall in demand, the new equilibrium has a (a) lower market price and a higher quantity sold. (b) higher market price and a higher quantity sold. (c) lower market price and a lower quantity sold. (d) higher market price and a lower quantity sold. 2. What happens when any market is in disequilibrium and prices are flexible? (a) market forces push toward equilibrium (b) sellers waste their resources (c) excess demand is created (d) unsold perishable goods are thrown out Want to connect to the PHSchool.com link for this section? Click Here!
The Role of Prices • What role do prices play in a free market system? • What advantages do prices offer? • How do prices allow for efficient resource allocation?
The Role of Prices in a Free Market • Prices serve a vital role in a free market economy. • Prices help move land, labor, and capital into the hands of producers, and finished goods in to the hands of buyers. • Prices create efficient resource allocation for producers and a language that both consumers and producers can use.
1. Prices as an Incentive Prices communicate to both buyers and sellers whether goods or services are scarce or easily available. Prices can encourage or discourage production. 2. Signals Think of prices as a traffic light. A relatively high price is a green light telling producers to make more. A relatively low price is a red light telling producers to make less. 3. Flexibility In many markets, prices are much more flexible than production levels. They can be easily increased or decreased to solve problems of excess supply or excess demand. 4. Price System is "Free" Unlike central planning, a distribution system based on prices costs nothing to administer. Advantages of Prices Prices provide a language for buyers and sellers.
Efficient Resource Allocation • Resource Allocation • A market system, with its fully changing prices, ensures that resources go to the uses that consumers value most highly. • Market Problems • Imperfect competition between firms in a market can affect prices and consumer decisions. • Spillover costs, or externalities, are costs of production, such as air and water pollution, that “spill over” onto people who have no control over how much of a good is produced. • If buyers and sellers have imperfect information on a product, they may not make the best purchasing or selling decision.
Section 3 Assessment 1. What prompts efficient resource allocation in a well-functioning market system? (a) businesses working to earn a profit (b) government regulation (c) the need for fair allocation of resources (d) the need to buy goods regardless of price 2. How do price changes affect equilibrium? (a) Price changes assist the centrally planned economy. (b) Price changes serve as a tool for distributing goods and services. (c) Price changes limit all markets to people who have the most money. (d) Price changes prevent inflation or deflation from affecting the supply of goods. Want to connect to the PHSchool.com link for this section? Click Here!
Section 3 Assessment 1. What prompts efficient resource allocation in a well-functioning market system? (a) businesses working to earn a profit (b) government regulation (c) the need for fair allocation of resources (d) the need to buy goods regardless of price 2. How do price changes affect equilibrium? (a) Price changes assist the centrally planned economy. (b) Price changes serve as a tool for distributing goods and services. (c) Price changes limit all markets to people who have the most money. (d) Price changes prevent inflation or deflation from affecting the supply of goods. Want to connect to the PHSchool.com link for this section? Click Here!
A C T I V E L E A R N I N G 3: A. fall in price of CDs • P • S1 • P1 • P2 • D2 • D1 • Q • Q1 • Q2 • The market for music downloads STEPS 1. D curve shifts 2. D shifts left 3. P and Q both fall. • 38
A C T I V E L E A R N I N G 3: B. fall in cost of royalties • P • S1 • S2 • P1 • P2 • D1 • Q • Q1 • Q2 • The market for music downloads (royalties are part of sellers’ costs) STEPS 1. S curve shifts 2. S shifts right 3. P falls, Q rises. • 39
A C T I V E L E A R N I N G 3: C. fall in price of CDs AND fall in cost of royalties STEPS 1. Both curves shift (see parts A & B). 2. D shifts left, S shifts right. 3. P unambiguously falls. Effect on Q is ambiguous: The fall in demand reduces Q, the increase in supply increases Q. • 40
EXAMPLE 3: A Change in Both Supply and Demand STEP 3, cont. • P • S1 • S2 • P1 • P2 • D2 • D1 • Q • Q1 • Q2 EVENTS:price of gas rises AND new technology reduces production costs But if supply increases more than demand, P falls.
A C T I V E L E A R N I N G 3: Changes in supply and demand Use the three-step method to analyze the effects of each event on the equilibrium price and quantity of music downloads. Event A: A fall in the price of compact discs Event B: Sellers of music downloads negotiate a reduction in the royalties they must pay for each song they sell. Event C: Events A and B both occur. • 42
CONCLUSION: How Prices Allocate Resources Markets are usually a good way to organize economic activity. • In market economies, prices adjust to balance supply and demand. These equilibrium prices are the signals that guide economic decisions and thereby allocate scarce resources.